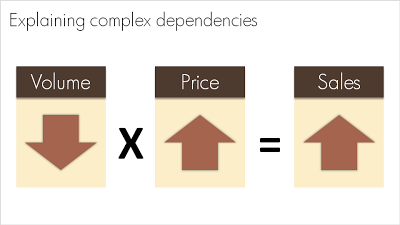
Basic equations to visualize complex dependencies
A question like "What happened to sales last year?" sometimes requires a complex answer. "Well, it is a bit complicated: volume went down, but then prices went up, but as a result sales were up". A simplified mathematical equation can help you visualize this.
 Sometime in the near future I will post here how to do a proper "sources of change" analysis.
Sometime in the near future I will post here how to do a proper "sources of change" analysis.