Streaming a presentation

Streaming a presentation

Music streaming services such as Spotify change the way musicians make music. With an unlimited amount of songs to listen to, users can now skip through tracks quickly. The result: musicians put the ‘hook’ or chorus of the song really early in the track to convince new listeners to stick around just a few seconds longer. During a live performance of the same song, the build up could be different.

The same applies to your slide decks that you send for someone to read without you being there to explain. The investor or customer is ‘streaming your slides’. Think about how to put that ‘hook’ in your story to keep the viewer interested.

Hooks don’t have to be blunt. A massive drum solo as your song opening might get people to hit the skip button. “We will have $3bn sales in 18 months” sounds impressive but might not be credible. An unusual chord change, or a counterintuitive perspective on the market could do the trick.

SlideMagic: a platform for magical presentations. Free student plan available. LEARN MORE
Visual math

Visual math

Following my post from last week about pi, here is a link to a page full of beautiful visualisations of mathematical concepts. Often, a written formula is not the right way to explain math and proportions….

SlideMagic: a platform for magical presentations. Free student plan available. LEARN MORE
Plugged in

Plugged in

This blog post by Fred Wilson resonated with me.

Surrounding yourself with smart people is not enough to make (investment) decisions. Now that I am knee deep into coding applications myself, I finally start to understand technologies that I have been pitching in dozens of slide decks over the past decades.

I think it goes a bit further than Fred’s blog post. Really smart people (not saying I am) with MBAs (I have one), that work at prestigious companies such as McKinsey (I worked there) are extremely good at telling you why something will not work, and 99% of the time their arguments make perfect sense. It is very hard for these people though to commit to believing in something that will work. Advisors are not entrepreneurs.

SlideMagic: a platform for magical presentations. Free student plan available. LEARN MORE
Winging it

Winging it

“Winging” a presentation, making it up on the spot, is extremely hard, and I would say, impossible. All people that seem to get up on stage and deliver a perfect pitch without any effort have in fact been rehearsing this over and over and over. (The previous instances where they pulled off the same trick). You need to practice really hard to be spontaneous.

When you look at a piece of paper with the scribbles of your thoughts, it seems like you have it all in your head. Everything is there. But standing in front of an audience is different. Your eyes are moving quickly across the piece of paper, going back and forth if relationships are not clear. With speaking, there is no rewind option. You need to build that “visual” in people’s minds step by step.

Many things can go wrong here:

  • You forgot the exact sequence of your points and you realize it too late, now you are stuck without a way to go back

  • You get distracted and are not sure where to pick things up, as you try to get your thoughts together, you repeat a few things you already said

  • You delivered that powerful punch line too early and now your speech ends with a mumbling “well, that’s it, thank you”

Don’t wing your pitch.

Image by ŠJů, Wikimedia Commons, CC BY-SA 3.0, Link

SlideMagic: a platform for magical presentations. Free student plan available. LEARN MORE
The right proportions in design

The right proportions in design

Certain layouts and compositions look right, others seem wrong. We can see it, but we can’t point our finger to exactly why.

This formula for the constant pi got my attention:

Screen Shot 2021-09-02 at 9.35.21.png

It is the so called Wallis product, a beautifully simple representation of a number that seems very random, the first 50 digits of pi are 3.14159265358979323846264338327950288419716939937510..…

Pi governs the shapes of rounded shapes, , waves and much more. The elegance of a circle is simple. But it is governed by a complex set of harmonics and ratios that all relate to each other. Beautiful designs have them, beautiful music has them. In most cases, we only appreciate the end result without grasping the underlying logic.

SlideMagic: a platform for magical presentations. Free student plan available. LEARN MORE
Presentation Zen on YouTube

Presentation Zen on YouTube

Garr Reynolds was the first presentation blogger in the world back in the mid 2000s. His book “Presentation Zen” is still the standard introduction into the world of presentation design. His blog has gone quiet over the past years, but recently Garr has been active on YouTube covering among other things how to improve your Zoom presentations. Garr might no longer be in your RSS reader, but it is worth adding him to your YouTube subscriptions.

SlideMagic: a platform for magical presentations. Free student plan available. LEARN MORE
Scaling of data charts in SlideMagic

Scaling of data charts in SlideMagic

In SlideMagic, you do not have to worry about picking the right scale for your data chart. The entire chart adjusts itself to the numbers you type in. See the example below:

Screen Shot 2021-08-31 at 7.33.04.png
Screen Shot 2021-08-31 at 7.33.33.png

To make sure that a consistent scale is used for your entire chart, you need to place all your data points in one shape, instead of using multiple shapes for example for each month.

Screen Shot 2021-08-31 at 7.35.37.png

P.S. I have added this monthly sales comparison chart to the SlideMagic slide library so you can easily use it in your own presentations as well. Search in the app for ‘sales’ and it will pop up.

SlideMagic: a platform for magical presentations. Free student plan available. LEARN MORE
How to punctuate bullet points

How to punctuate bullet points

Dr Clare Lynch is “chief business writing expert” at Doris and Bertie Ltd and a University of Cambridge writing instructor, she has an excellent YouTube channel that deserves more viewers.

In a recent video, she explains the official rules for punctuating bullet points, full stops or not, capitals, etc.

She gives 3 options and a warning:

Colon: no capitals, no full stops

Colon: no capitals, no full stops

The long hand version with capitals, and full stops

The long hand version with capitals, and full stops

For writing: semi colons

For writing: semi colons

Don’t mix sentence styles

Don’t mix sentence styles

Back at McKinsey in the 1990s, we were taught to write paragraphs in bullet point form but starting with what we called a “clunk”, with a heavy paragraph sign as the bullet point anchor (a pilcrow), and leave the full stop out after the last sentence (but use them for other sentences in the bullet point paragraph).

In presentations? First rule avoid bullet points if you can. If you to include some sort of list to make your point on a slide:

  • I try to keep the text super short (even shorter than Clare in the above examples)

  • Try using some repetition: Higher sales, higher market share, lower costs (“business poetry”)

  • And pay close attention to the length of the text I am writing, I want all text boxes to be roughly the same in terms of length. Yes, I admit that I sometimes “stuff” a super short bullet point with a non-essential word to make it look prettier…

SlideMagic: a platform for magical presentations. Free student plan available. LEARN MORE
Songs written in less than 20 minutes...

Songs written in less than 20 minutes...

A clickbait link popped up on my phone with songs that were written in less than 20 minutes (I am linking to another post with the same subject).

Yes, these songs might have been written in 20 minutes, but I am sure that those 20 minutes are the result of years of practice, trying, and noodling by these musicians. All that effort that was built over a long time just fell in the right place.

I think this is true for every creative process, including presentation design and storytelling. In Hemmingway style: ‘gradually, then suddenly”, Seth Godin talks about it in “The Dip”, a tank filling up drop by drop until it finally bursts with great force.

SlideMagic: a platform for magical presentations. Free student plan available. LEARN MORE
Server move

Server move

I will be getting back to writing blog posts as we are slowly moving towards autumn.

Over the past weeks, I have been preparing a switch of cloud infrastructure provider for SlideMagic to Amazon AWS. The second (stealth) project I am working on requires a very high level of security that could not be delivered by the existing platform. It is amazing what infrastructures you can put together in 2021 at the click of a button.

I have just switched the SlideMagic backend over to the new servers (sweaty palms…) and everything seems to be working OK. I know that there many pioneer users among the readers of this blog, if you spot anything unusual happening, please reach out to me at jan at slidemagic dot com.

SlideMagic: a platform for magical presentations. Free student plan available. LEARN MORE
Shuffling

Shuffling

Another slide makeover. I will post the ‘after’ before the ‘before’, since the email delivery service sometimes does not render all the images I put in my blog posts…

And here is the original, created by The Information

Screen Shot 2021-08-10 at 7.32.15.png

What did I change?

  • I shuffled rows and columns to get the biggest possible continuous space of similar blocks, this is visually more pleasing, and groups/ranks players in a better way. (Hmm, should have swapped Instagram and TikTok now that I look at it).

  • I changed the colors, the traffic light analogy does not really work here. The “yes” and “testing” should be very similar in color, while the “no” should be a clear gap.

  • I added a more punchy headline

  • I calmed the whole chart down by simplifying the legend and taking out the logos.

I have added the slide to our template bank. Users of SlideMagic (try it, there is a free version), can access the slide by searching for “social” in the template bank.

SlideMagic: a platform for magical presentations. Free student plan available. LEARN MORE
Leaving the math to your audience

Leaving the math to your audience

It is raining COVID statistics in Israel as we are the first country in the world to deal with a post-vaccination outbreak. Below is one table that was released by the Ministry of Health (I found it here).

Screen Shot 2021-08-05 at 9.39.31.png

I have translated it in a quick SlideMagic chart (it always puts a big smile on my face to see how quickly this can be done).

Screen Shot 2021-08-05 at 10.01.34.png

But this data is horrendous to understand. Percent of what? What is 100%? The audience is left to do the math themselves. Compare the categories to the breakdown of the population, look at differences between 3 and 7 days ago, look at the ratio between mild to severe, etc. etc.

Using bars instead of numbers (another smile) makes things a bit clearer.

Screen Shot 2021-08-05 at 10.05.28.png

But in this case, it would have been clearer to release the data in absolute numbers and let people construct their own charts.

I have added the charts above to the SlideMagic library, search for COVID in the app and the slides will show up (see the search here).

SlideMagic: a platform for magical presentations. Free student plan available. LEARN MORE
Summer break.

Summer break.

As usual, I am dropping the frequency of blog post for a few weeks in summer, I hope you all have a relaxing holiday.

SlideMagic: a platform for magical presentations. Free student plan available. LEARN MORE
"Empty" images

"Empty" images

When looking for images for your presentation (SlideMagic has a great built-in image search engine), consider searching for images that are relatively “empty”, i.e., images with a lot of white space. This allows you to set them as the background for your entire slide. See the example below.

Screen Shot 2021-07-25 at 12.31.37.png
Screen Shot 2021-07-25 at 12.31.41.png

Pick your keywords to find these type of layouts: empty, background, wallpaper, sky, cliff, horizon, etc. etc.

Photo by Zoltan Fekeshazy on Unsplash

SlideMagic: a platform for magical presentations. Free student plan available. LEARN MORE
Cheating with statistics

Cheating with statistics

The chart below (source) is a good example of “axis”. The drop in life expectancy looks huge, but upon closer inspection, we see the the vertical axis starts only at 72.

There is another problem with the chart: “the sharpest since World War II” is not supported by the data.

One way to bring out the significance of the message, and support the WWII point is to show the annual change (not the absolute number) in life expectancy since 1940.

SlideMagic: a platform for magical presentations. Free student plan available. LEARN MORE
Different levels in presentation templates

Different levels in presentation templates

A “presentation template” is usually a PowerPoint file that new employees receive on their first they of work. There is more to a presentation template I think.

  1. Your corporate visual communication style/culture

    • Consulting firms: lots of complicated diagrams and frameworks, meant for solving a problem rather than presenting

    • Investment banks: dense text and tables with graphs, meant for reading rather than presenting

    • Consumer goods company: product packaging shots and bullets

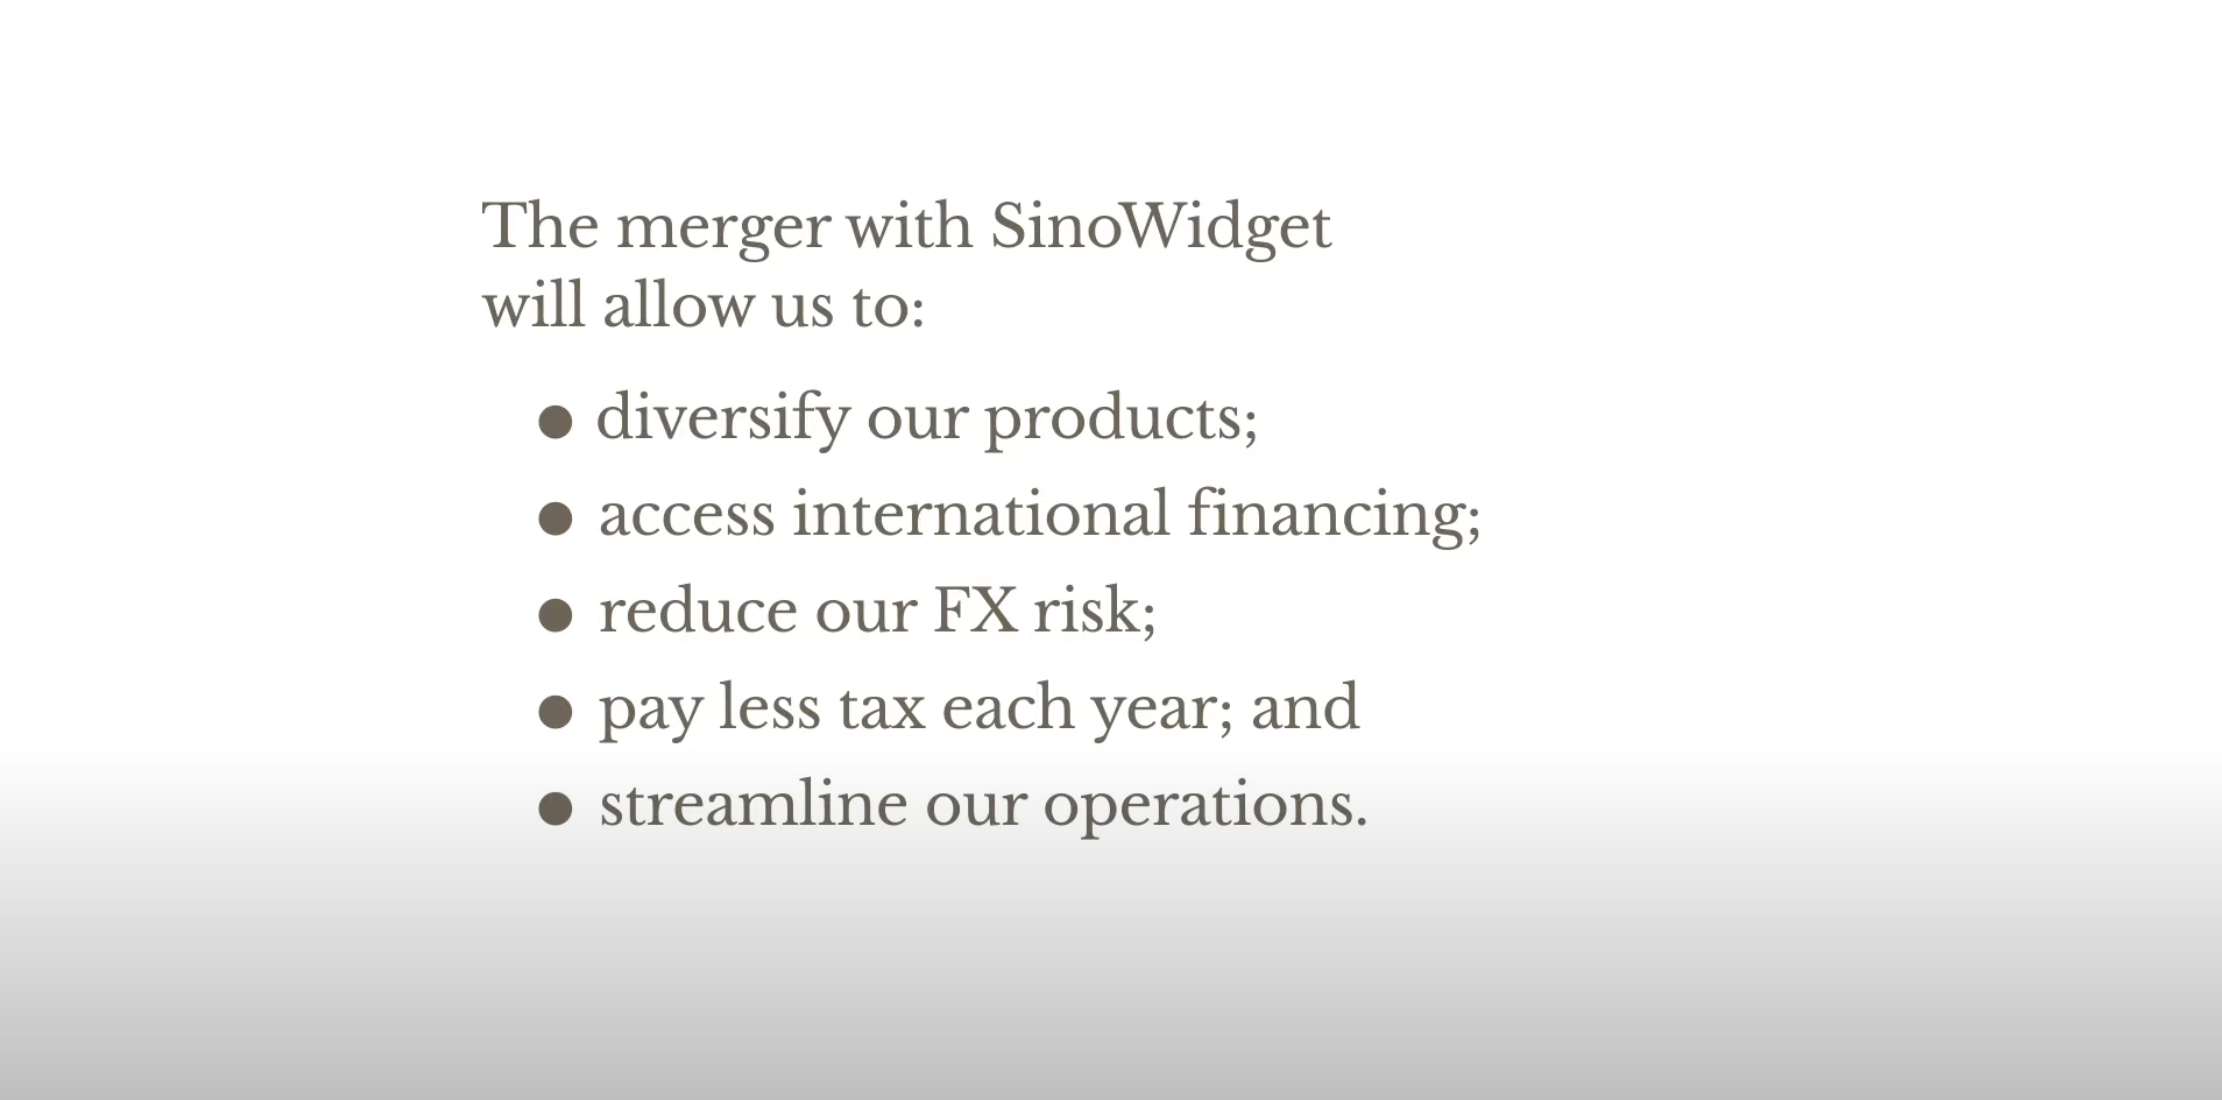
    • University: list of bullets

    • Etc. etc.

  2. The actual software file that holds the basis layouts, logo, and colours (this is the one you get on the first day of your employment)

  3. Running versions of important presentation documents that get constantly updated and tweaked

    • Sales presentations, each for a different lead or a different customer segment

    • Quarterly results presentations with - well - different quarterly results

    • Strategic planning presentations, each one for a different product group

    • Etc. etc.

Most of the day-to-day presentation work in companies is in step 3, the tweaking of existing documents to update it for the latest sales meeting or board meeting. These presentations are in fact the “templates”, not the empty file.

In most presentation design software the tweaking of an existing slide is tricky and over time a slide degrades after many iterations where users insert the wrong fonts, colours, and trip up a decent slide layout that worked for 5 boxes, but not for 6. (“Template rot”).

The above is true for both existing corporate presentations and shiny new templates purchased online. The latter look amazing fresh off the press, but it shows when a non-designer tried to fit it to her needs.

With SlideMagic we are trying to fix this. Make it easy to create decent looking presentations from scratch, but even more importantly, make it super easy to tweak this presentations, keeping everything aligned on an brand.

By fixing step 2 and 3, we hope to fix step 1 as well…

SlideMagic: a platform for magical presentations. Free student plan available. LEARN MORE
Trying to understand vaccine effectiveness

Trying to understand vaccine effectiveness

Here in Israel we are ahead of most other countries in terms of vaccination and the prevalence of the delta variant. After almost zero cases, the count is starting to creep up again. There is a lot of confusing data going around and it is surprising to me that the scientific community does not have a generic approach to evaluate the effectiveness of vaccines.

Last night the following table appeared on the TV news. Severe cases by age category and vaccination status. But these absolute numbers cannot be taken at face value.

Screen Shot 2021-07-19 at 12.24.52.png

“Open source” statisticians went to work and made some adjustments. The population categories are not equally big (there are more young people than old people), and the vaccination rate is not the same (older people vaccinate more). So the correct approach is to look at severe cases / million, split by vaccinated and unvaccinated. I put the results in the graph below and added the chart to the SlideMagic library.

Screen Shot 2021-07-19 at 12.05.23.png

I put the results in the graph below and added the chart to the SlideMagic library. Search for “vaccine’ in the SlideMagic app and the designs will pop up, either for use in a COVID-related presentation, or maybe something completely different that requires a similar layout.

SlideMagic: a platform for magical presentations. Free student plan available. LEARN MORE
Lost in translation

Lost in translation

Many presentations are good because there are many steps involved between the “source” and the “receiver”

  1. You have the story in your head as a complex set of ideas that are entangled and interdependent

  2. You start writing it down in short hand, which require you to “flatten” the multi dimensional story into a sequence.

  3. The sequence of bullet points now becomes a visualisation of your story. Instead of listening to a complex verbal argument, your eyes glance through the points and you can change the order at lightning speed. Cut, paste, slice, dice, until it looks good to you (without taking into account how it sounds).

  4. Many people stop here and jump to stage 6

  5. Now, chunks of this “visual” bullet point story get translated into visuals, another transformation: sentences, words, paragraphs get turned into visual compositions and graphs.

  6. The presentation to the audience is no longer your story, it is you translating the visuals back into sequential verbal text.

  7. The audience listens to the sound track of your slides and tries to reassemble the story that was in your head when you started the whole process.

Photo by Eirik Skarstein on Unsplash

SlideMagic: a platform for magical presentations. Free student plan available. LEARN MORE
Your presentation "secret weapon"

Your presentation "secret weapon"

We are doing some SlideMagic user interviews and the term “secret weapon” came up. One user, somewhere in a big office tower, is a lone user of SlideMagic and uses the build-in PowerPoint conversion to share slides with colleagues. People start to notice the difference in the slide the person produces.

Here are some situations where you can use SlideMagic as a secret weapon, a starting point for setting up the beginning of your presentation. Most of these slides are very time consuming to set up in PowerPoint or Keynote:

  • A perfectly lined up, massive grid of logos (you finished the 10 x 4 grid, and now you need to move to 7 x 6 because you got 2 more logos)

  • Data tables with bar charts that need to line up (oops, 12 rows instead of 10)

  • 2x2, 3x3 matrices, other consulting style matrices

  • A diagram with boxes that are connected with arrows

  • A team chart where all the headshots need to have more or less the same size, with the “eye line” at the same height

Nobody needs to know / find out that you use SlideMagic, but we would not mind if you spread the secret…

Photo by Joshua J. Cotten on Unsplash

SlideMagic: a platform for magical presentations. Free student plan available. LEARN MORE
Think of image colour

Think of image colour

Image libraries (including the ones that are available in within SlideMagic) have become so huge that you can afford to be very picky when it comes to image searches. Next time, don’t just use a keyword, but also pay attention to colour. And not just your accent colour of your brand book, but also complementary colours. We will add this colour filtering to the feature pipeline of SlideMagic.

I am in the process of a total overhaul of the SlideMagic web site and using this principle myself, focusing on images that fit with SlideMagic blue, or its opposite, orange.

Screen Shot 2021-07-14 at 12.48.00.png

(Still great to see how SlideMagic’s automatic image cropping gets it right in most of the cases)

SlideMagic: a platform for magical presentations. Free student plan available. LEARN MORE