

Adding columns and bars to data charts
Data charts are linked to the slide grid to make it easy for you to add labels, integrate them into tables, and keep them fitting with the overall layout of the slide.
The implication of this is that you need to add/remove bars and columns to a data chart by manipulating the slide grid.
The number of bars in a bar chart or a vertical waterfall chart is set by the number of rows the chart box covers
The number of columns in a column chart, stack chart, or waterfall chart is set by the number of columns the chart box covers
Horizontal waterfall charts have a minimum of 3 columns, vertical waterfall charts have a minimum of 3 rows (start, one delta, end).
See the examples below.

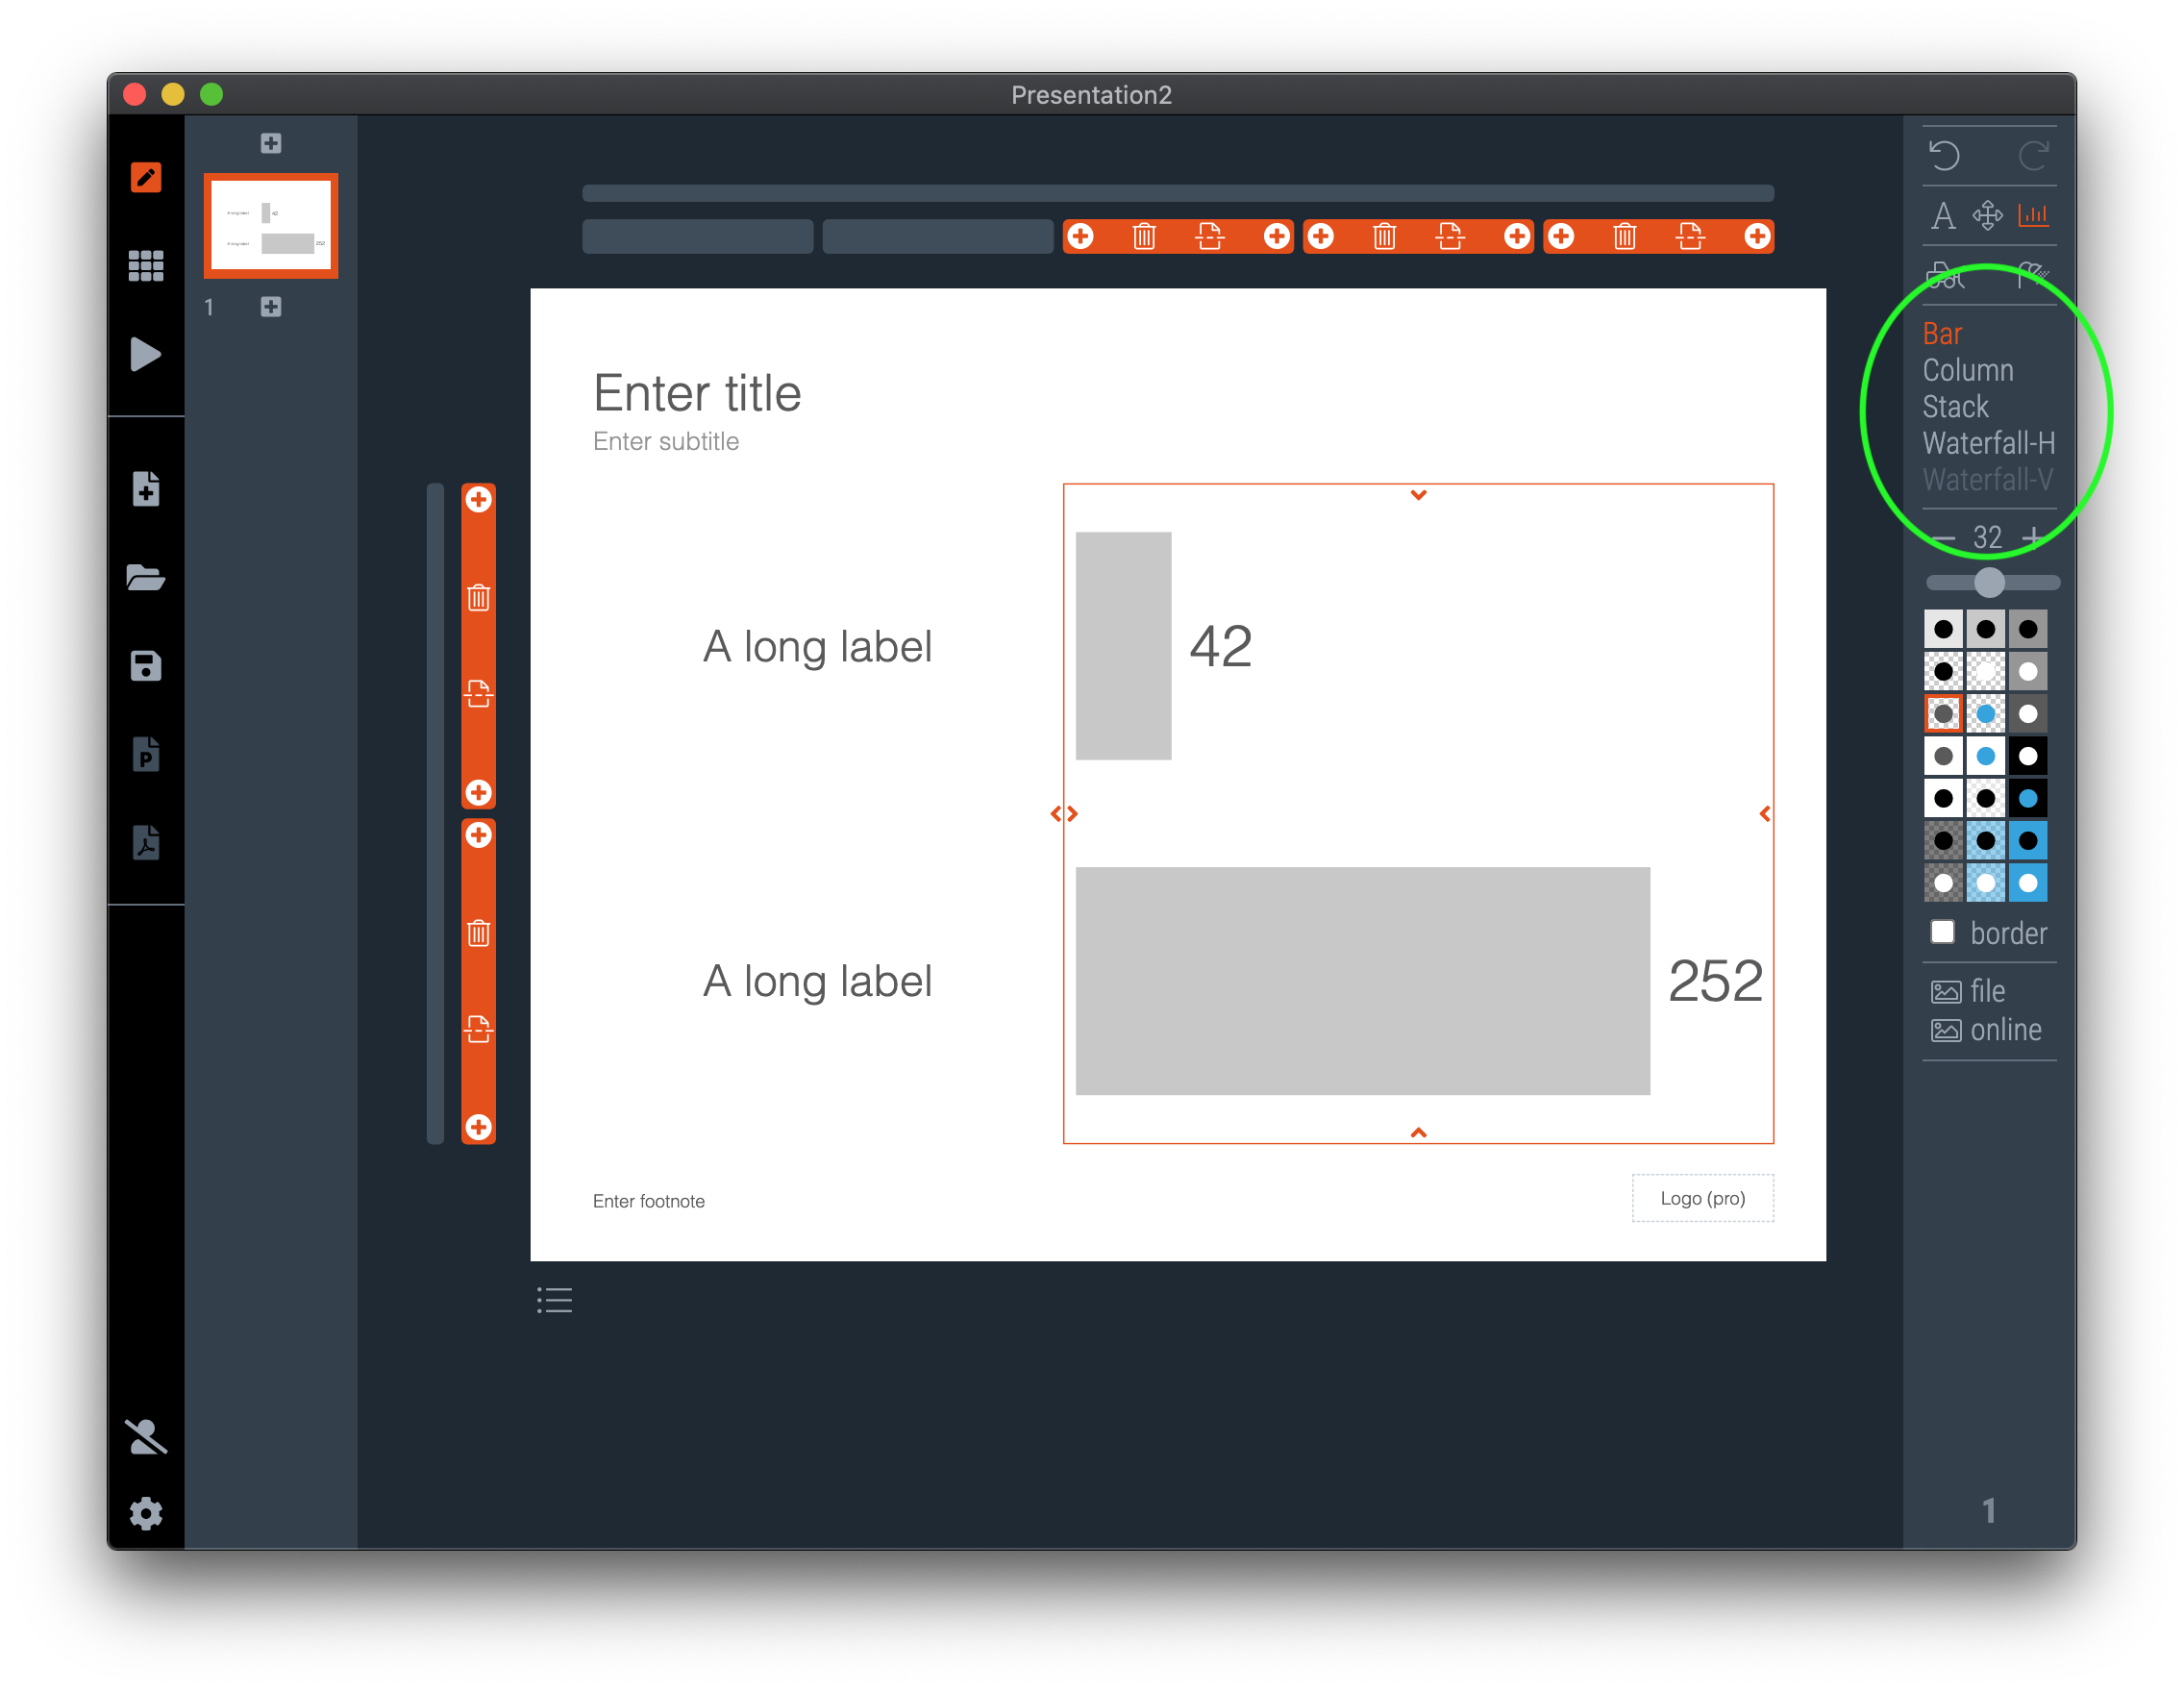
The number of bars in a bar chart is set by the number of rows its box covers. Add a bar by adding another row to the grid.

To add a bar at the bottom of a bar chart, expand by grid box by clicking the down arrow
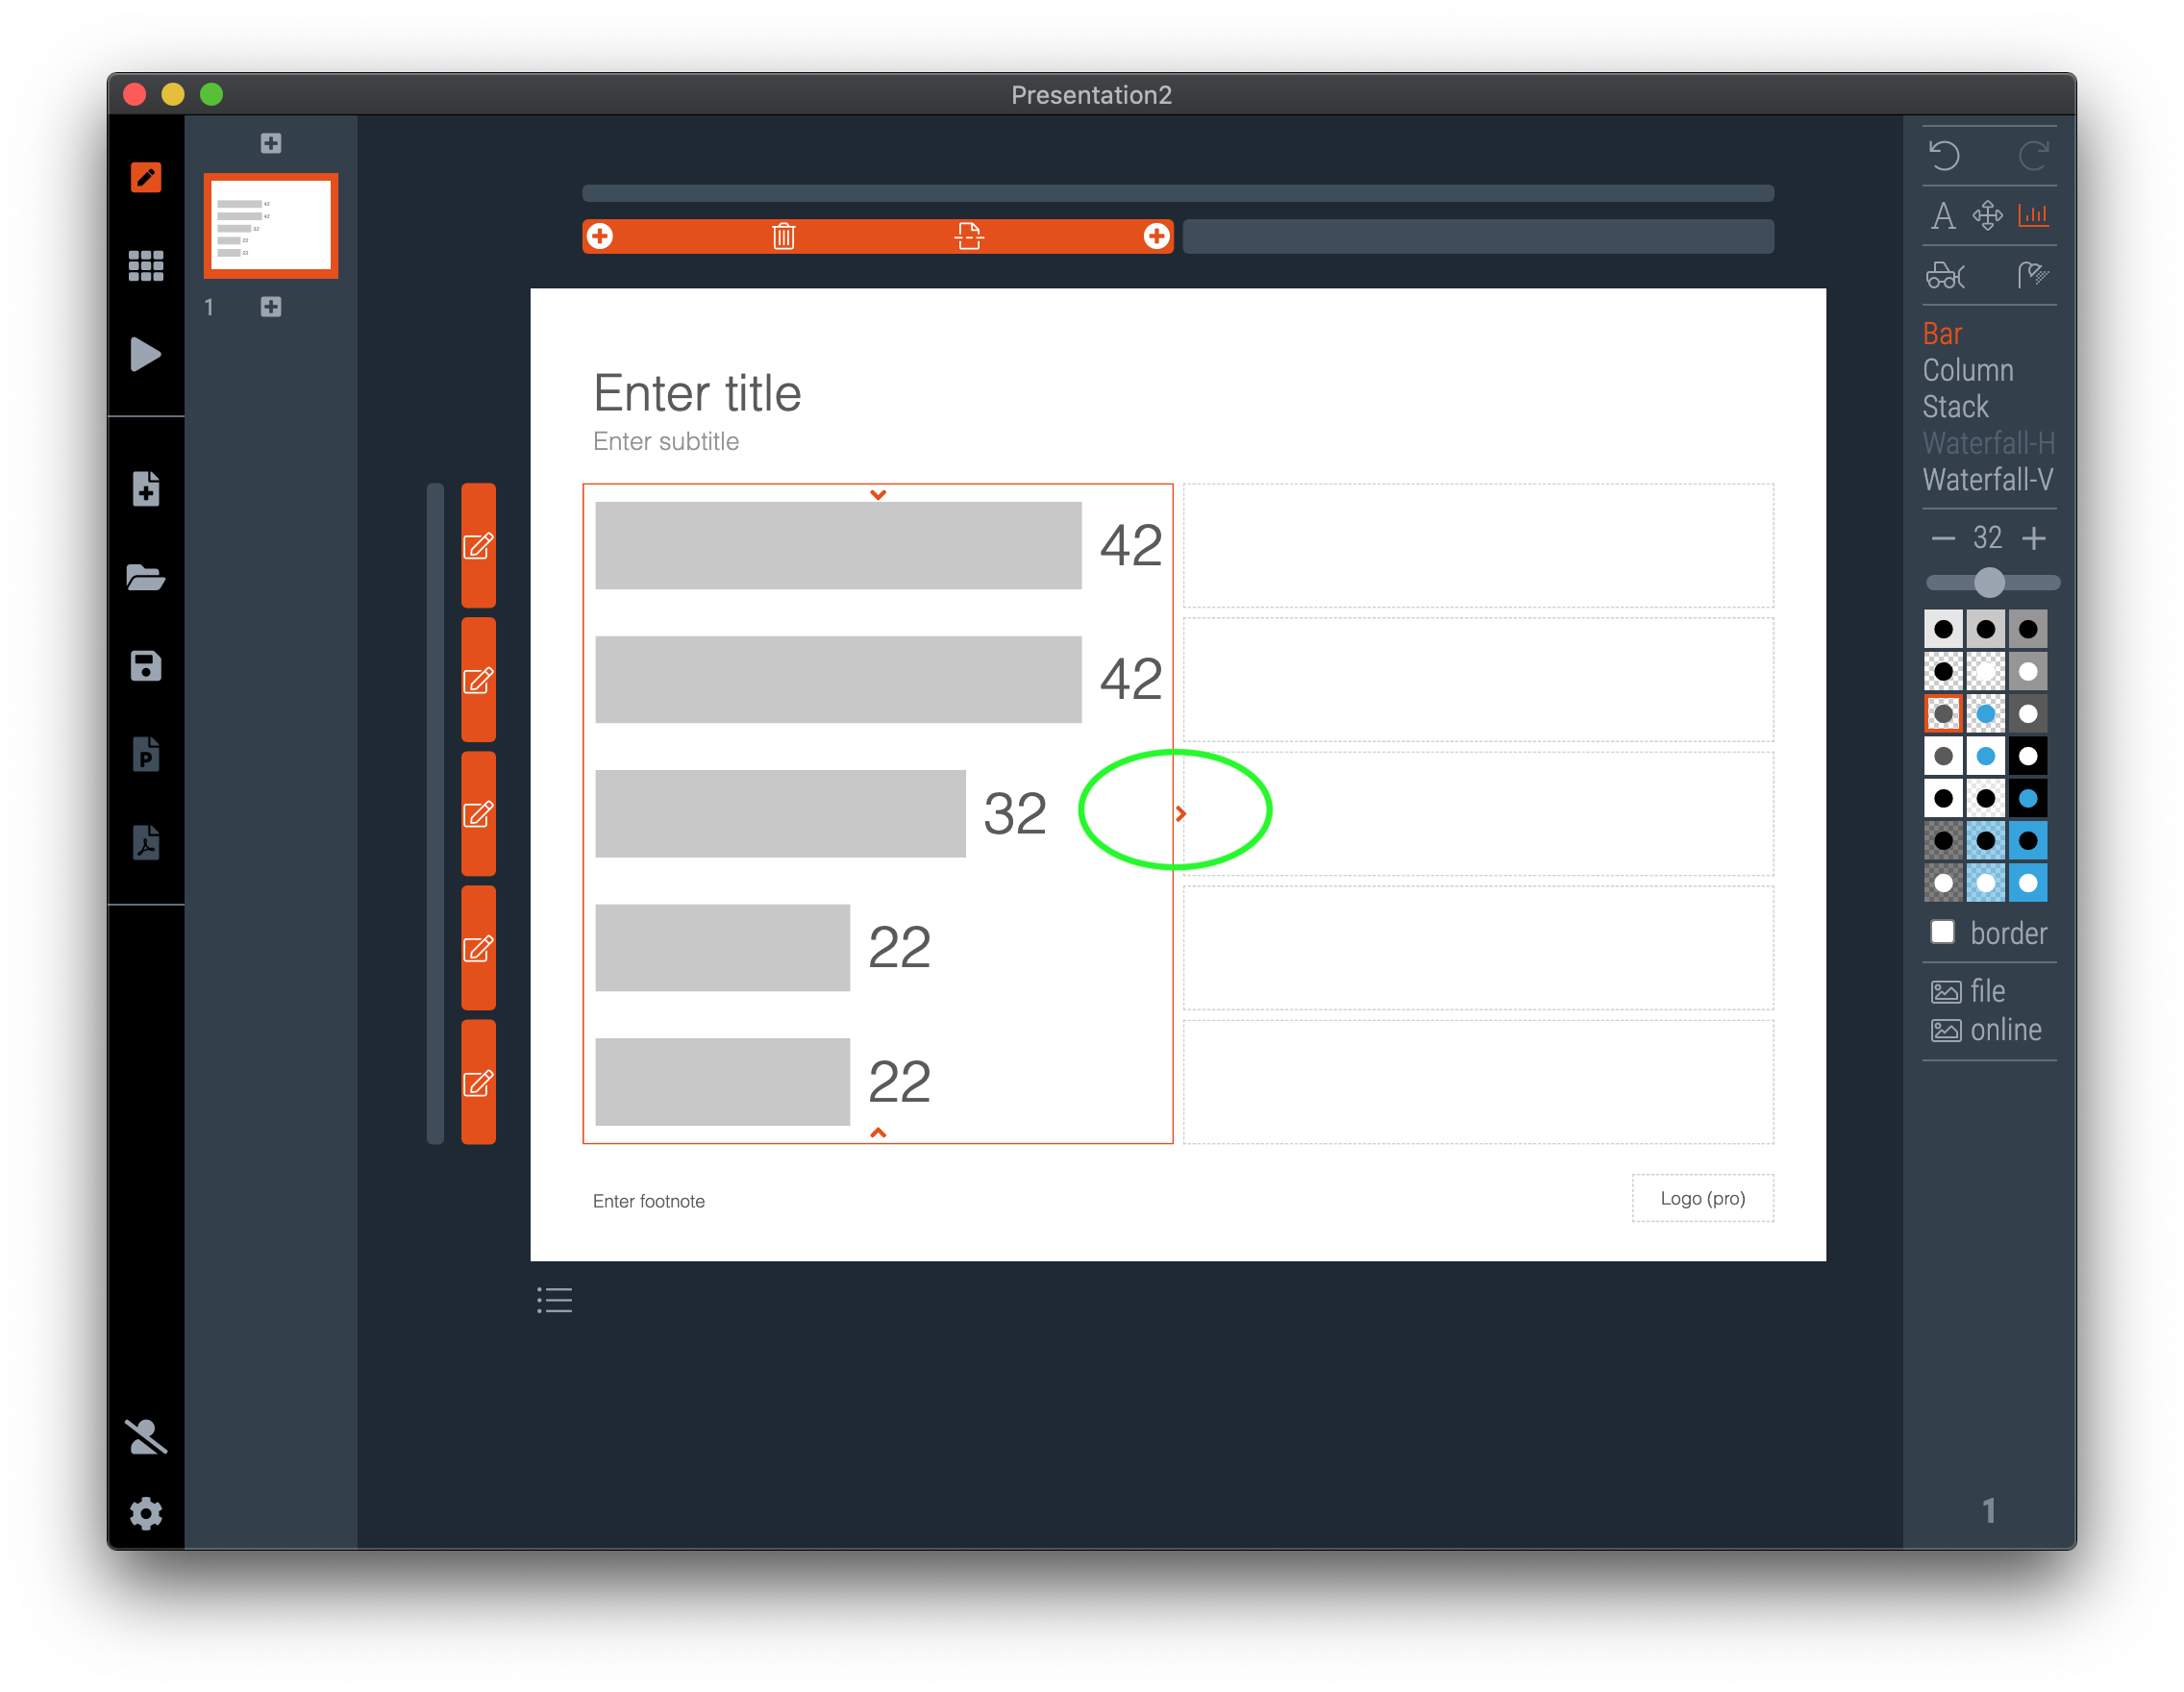
To make the bar chart cover more of the slide, expand the grid box to the right by clicking the right arrow

Note that in this layout, the 2 columns have no visual effect on the slide.
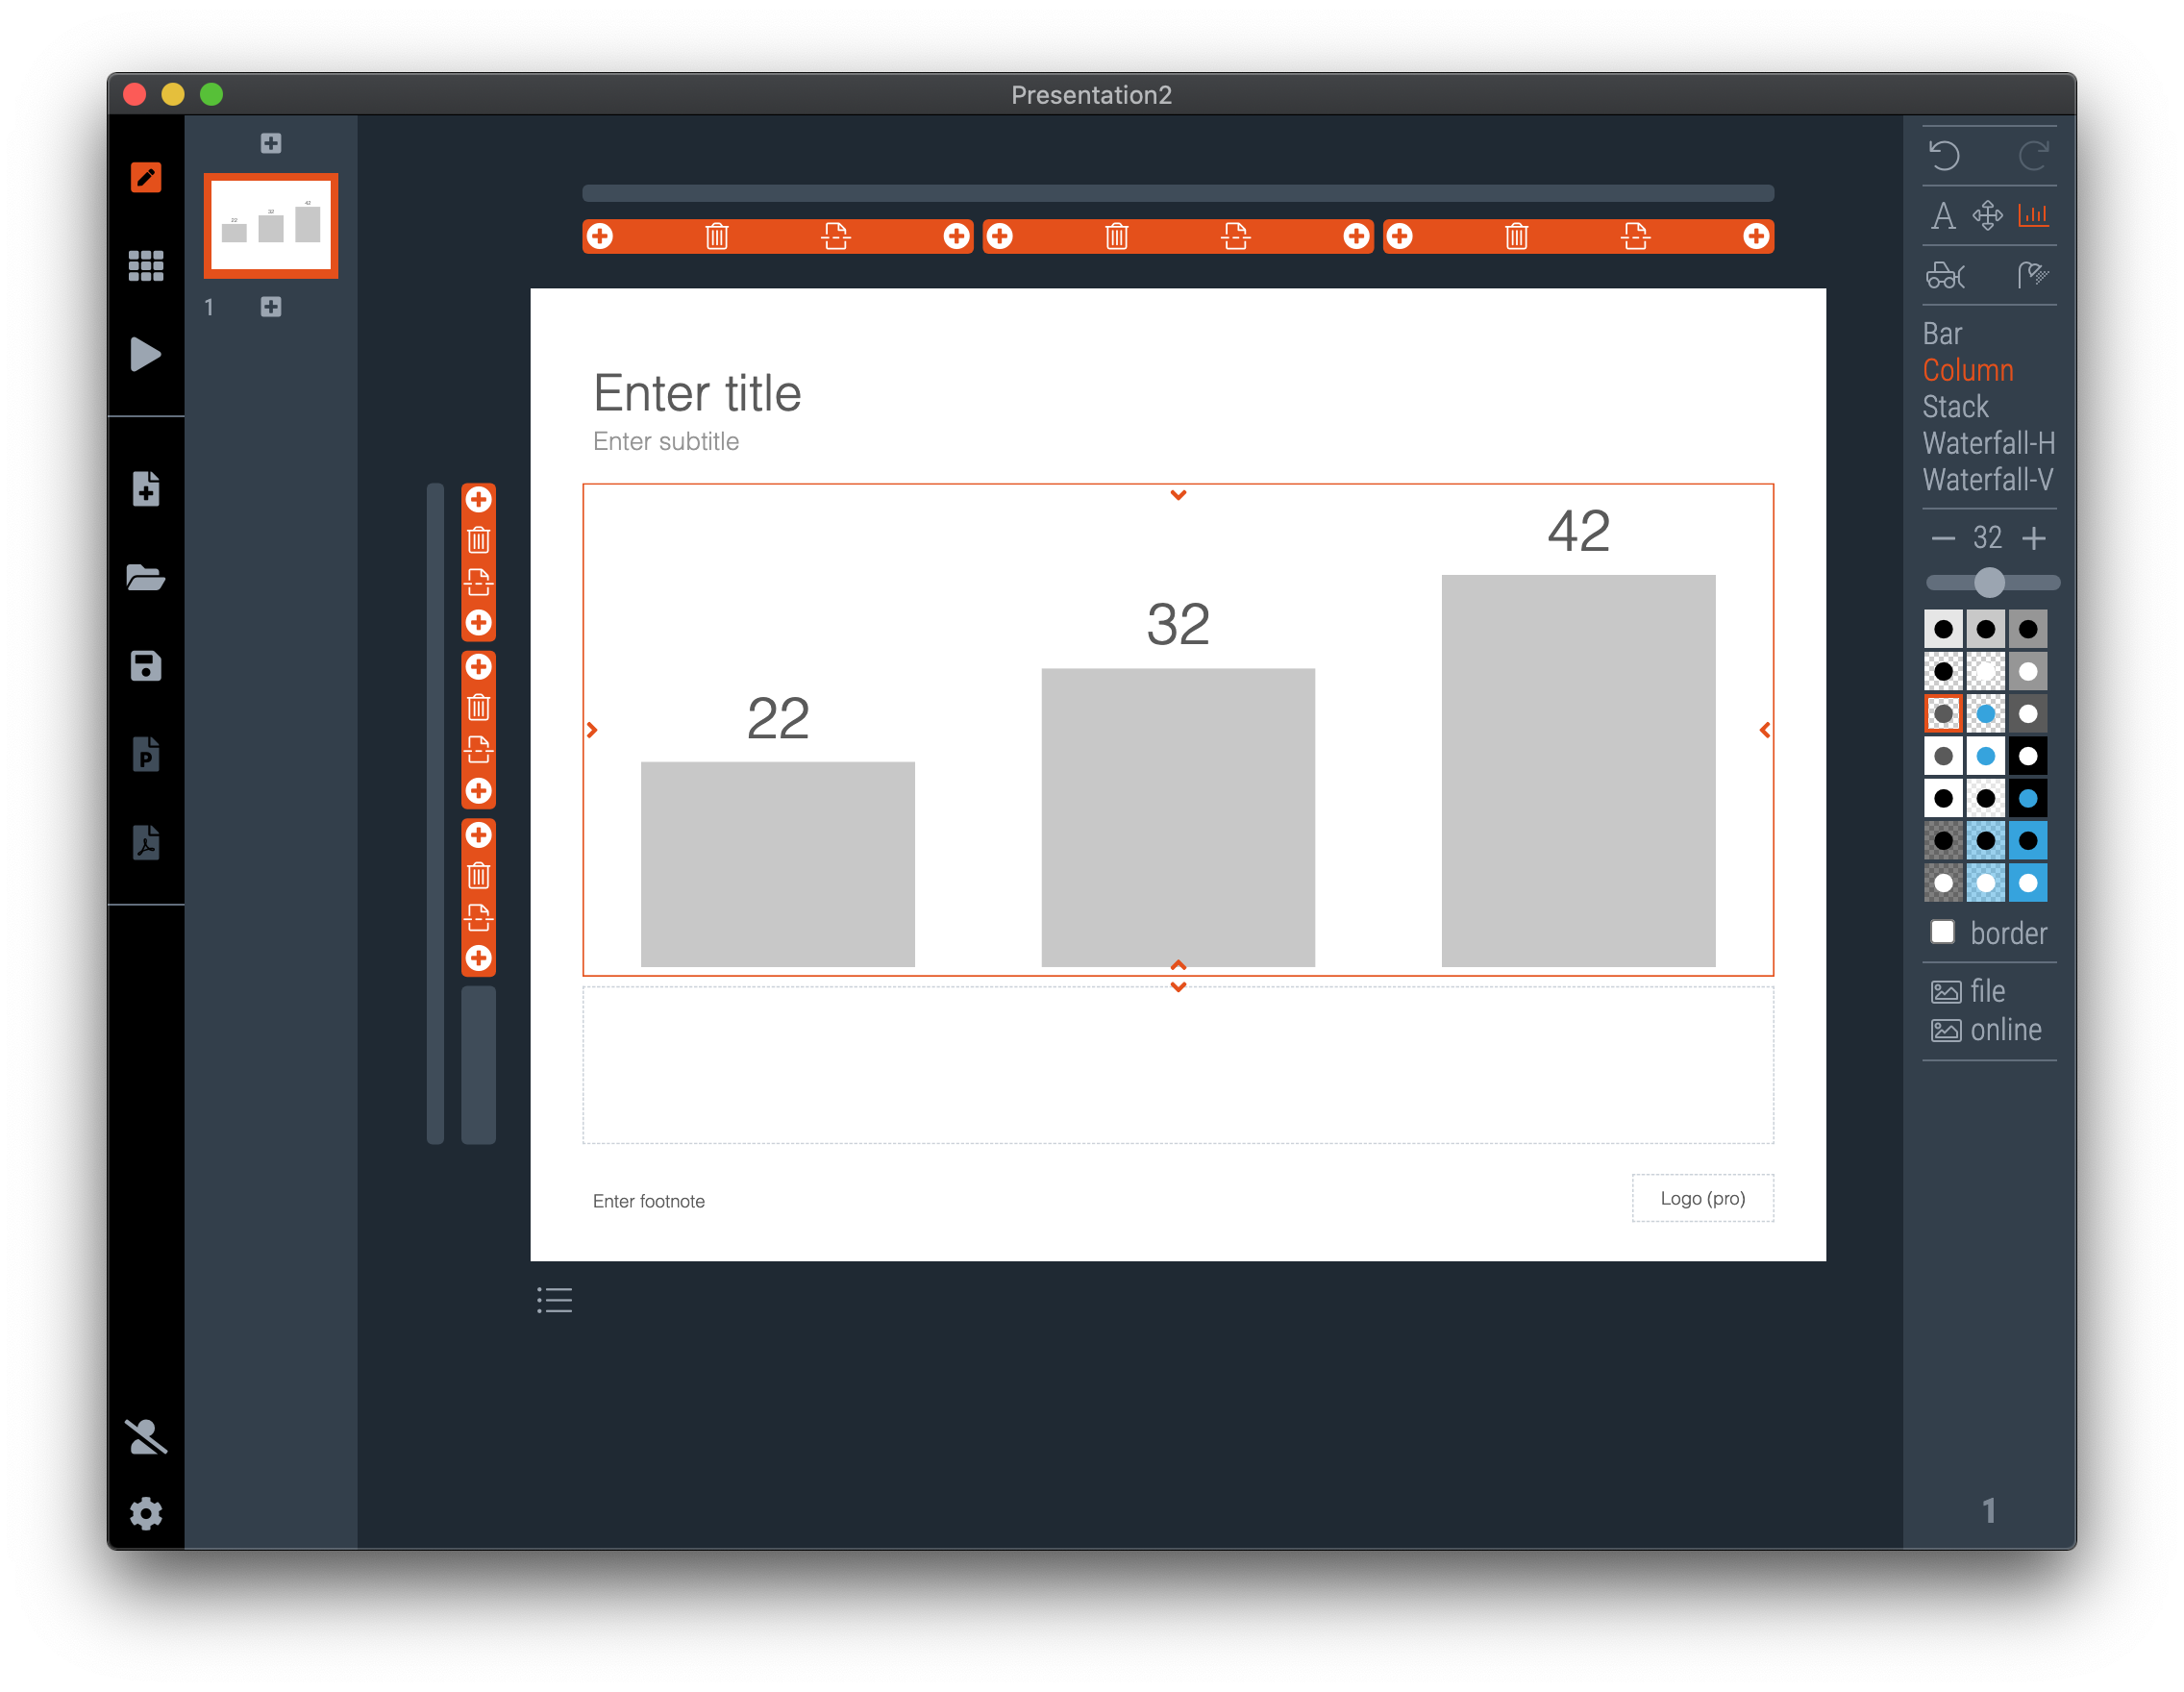
Apply the above guidelines in exactly the same way for column charts…
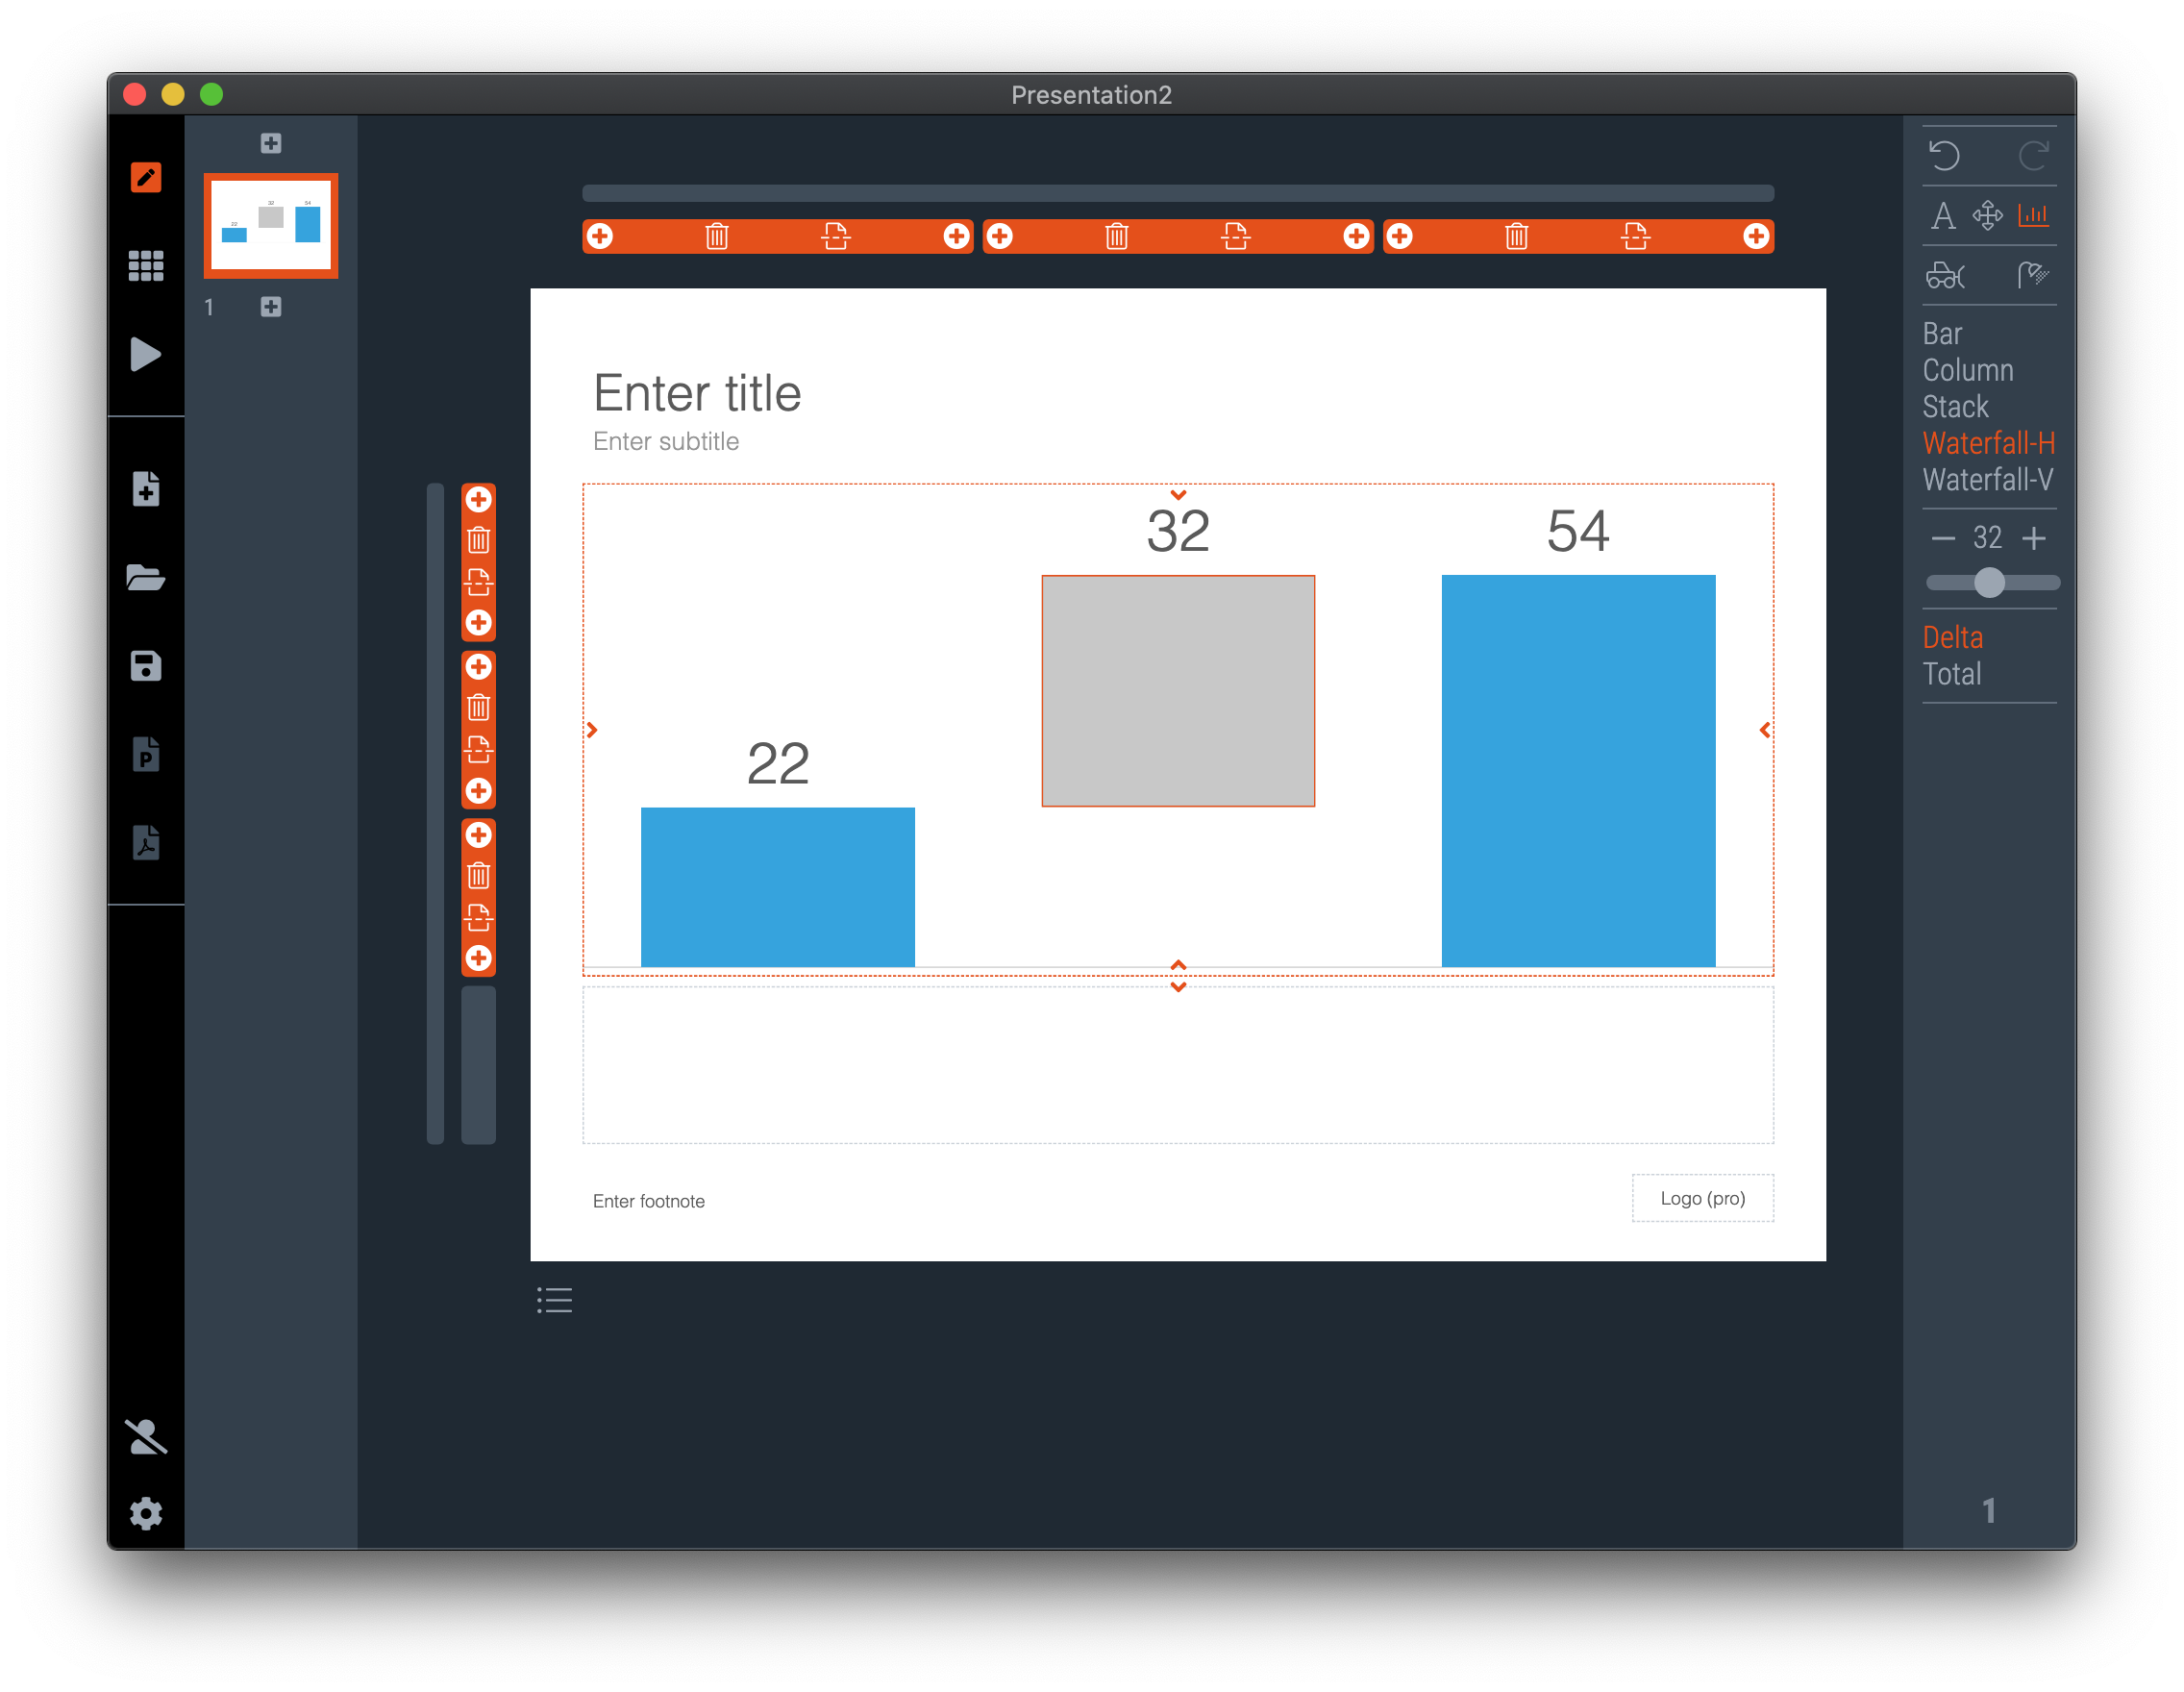
… and waterfall charts
Changing the content and appearance of a data chart
Click one of these elements of a data chart to make changes to the way it looks:
The entire grid box of the data chart:
Add/remove columns and bars
Change the colour scheme of the entire data chart
Change the font size of text in the entire data chart
The bar or column: apply an accent colour to the data point or data series
The data label: change the numeric value of the data point

With the entire chart selected, you can make changes to colours and fonts
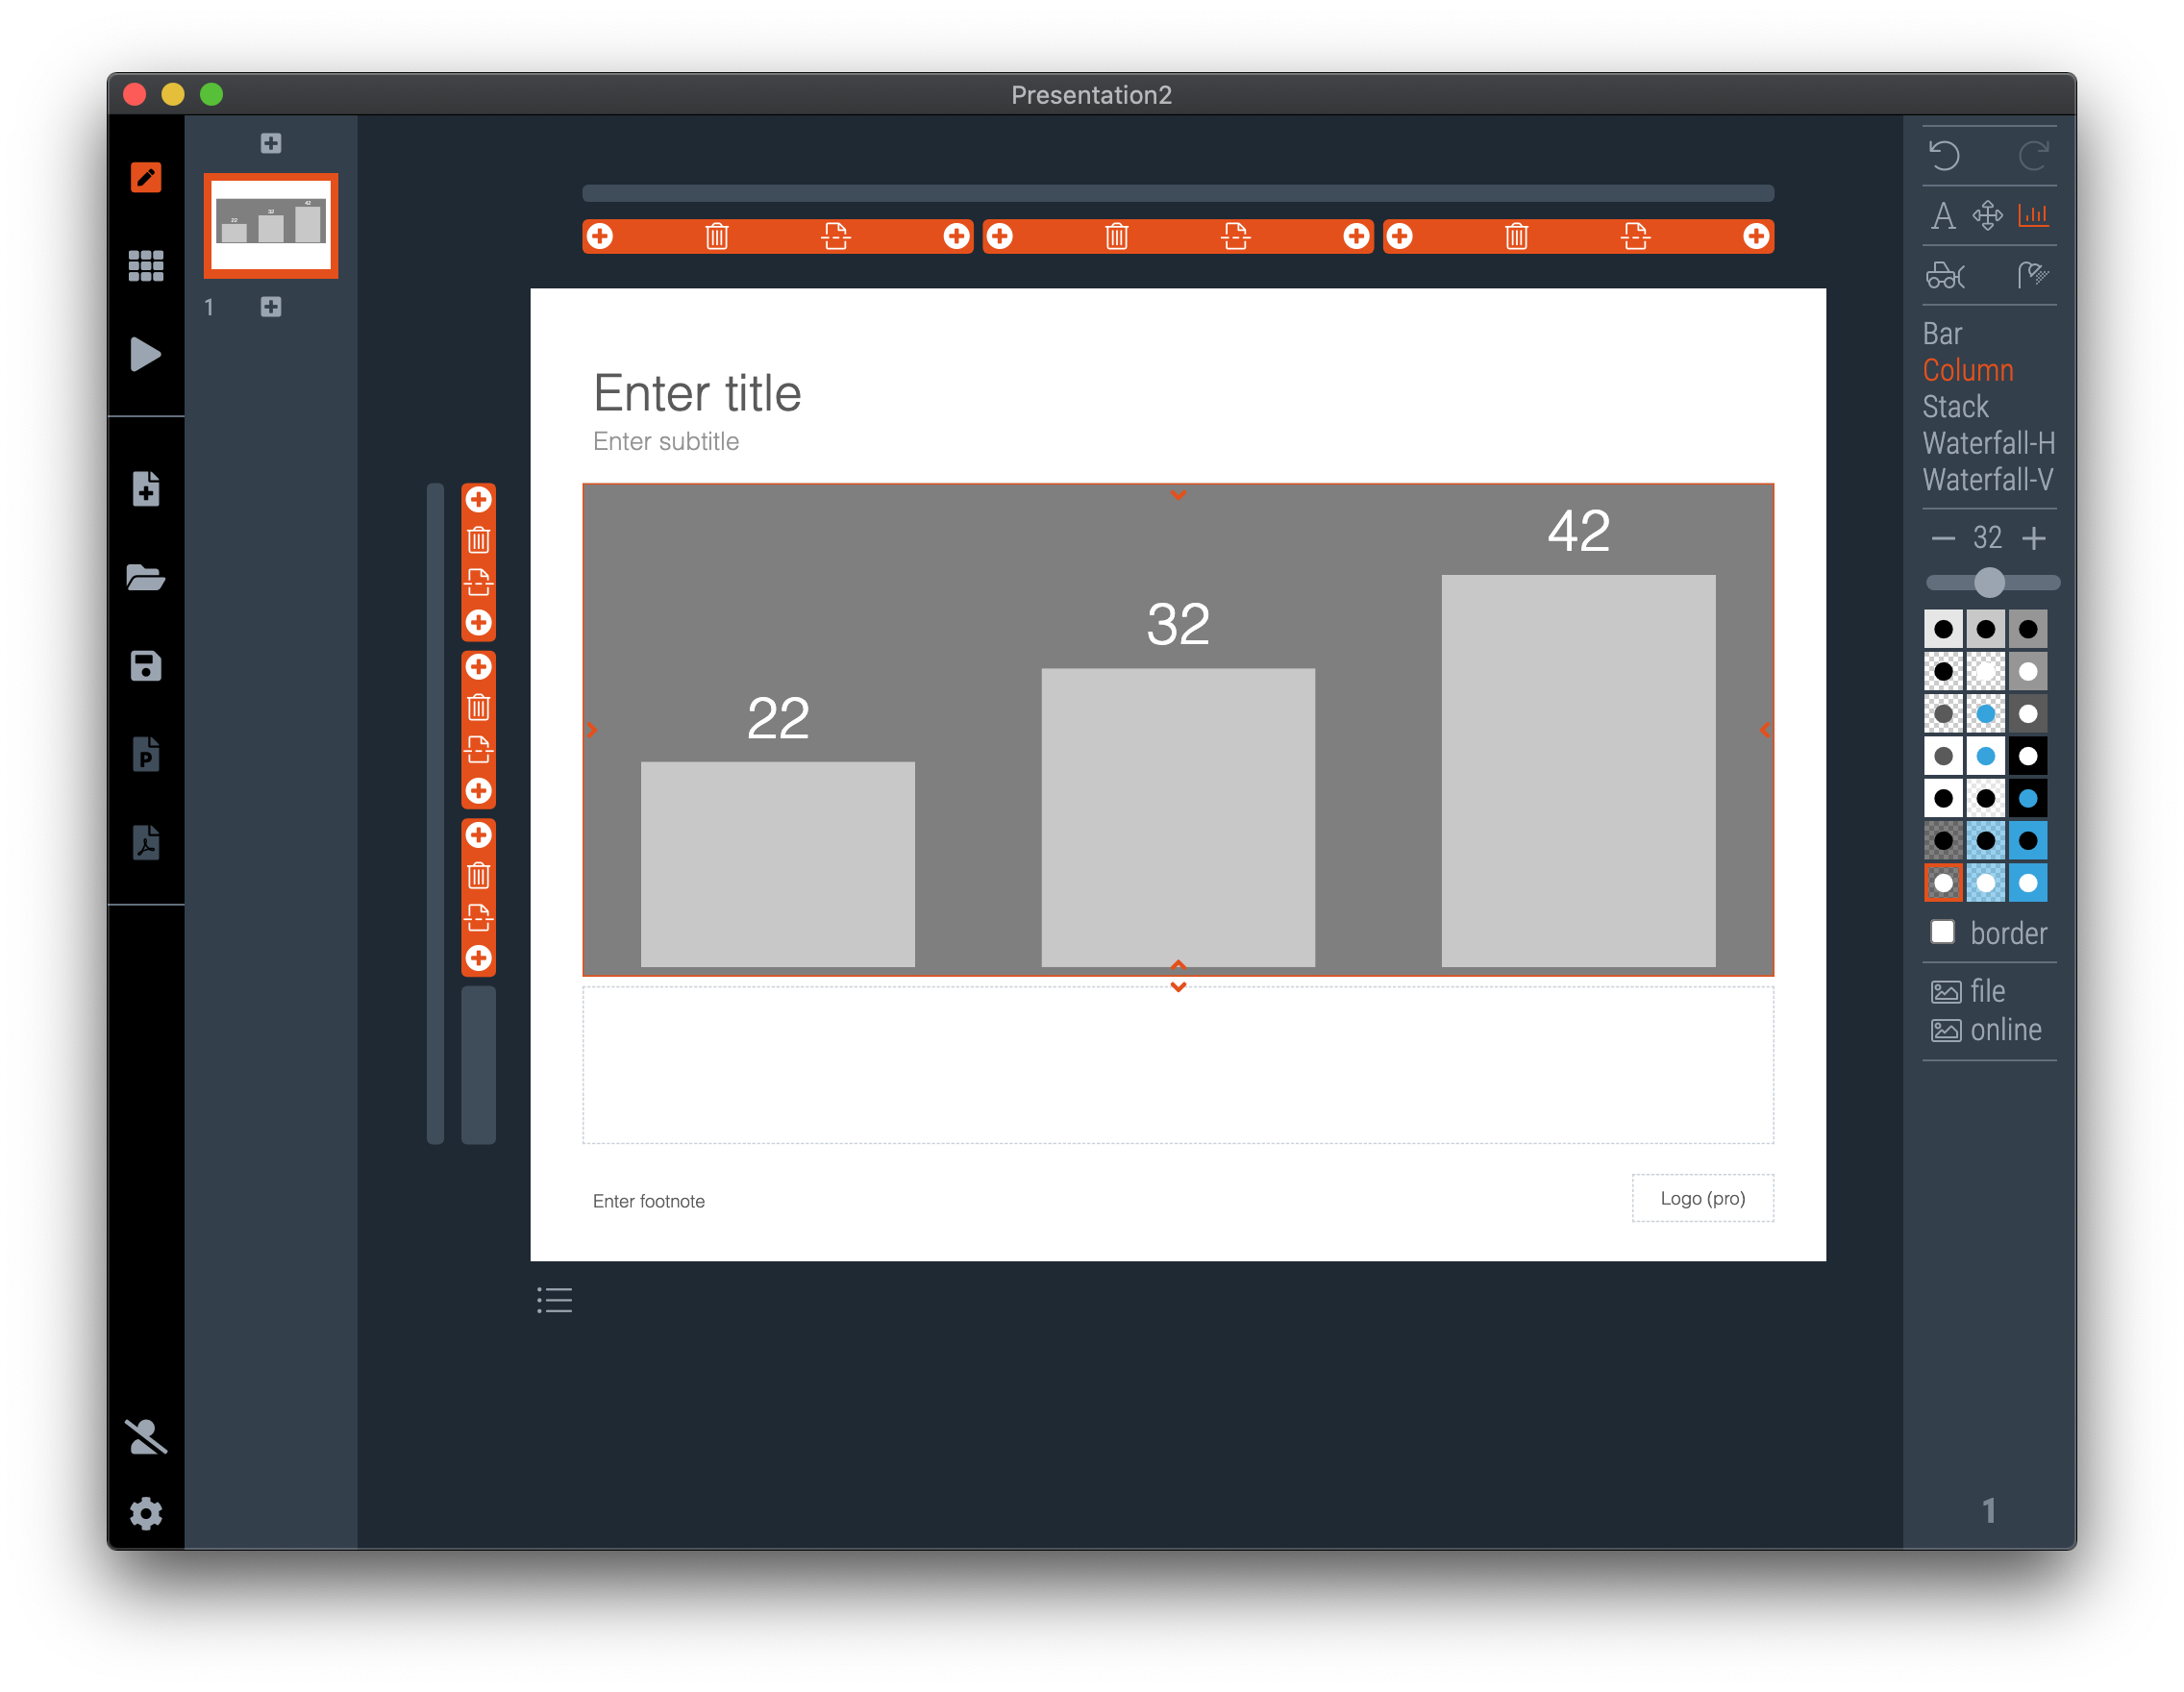
Selecting a colour will apply a fixed colour scheme that has been designed so that text, bar/column, and background colour fit together

With a bar/column selected, you can apply an accent colour to a data point…

…or set an accent colour to a data range in case of a stack chart

In chart view, a stack chart’s stacks appear in true size, but it can be hard to edit stacks that are very small in size

In table view, all the stacks of a stack chart are rendered in equal size, making it easy to edit its data, also for very small values
SlideMagic supports vertical waterfall charts (bars) and horizontal waterfall charts (columns). Vertical waterfall charts might work better when you need to add very long labels for each of the data points.
To make a waterfall chart, create a grid box with the required size, add the data points and select for each data point whether it is a total or a delta value.
How to make a waterfall chart

Set the required number of columns for your waterfall chart and decided whether the data point is a delta…

…or a total
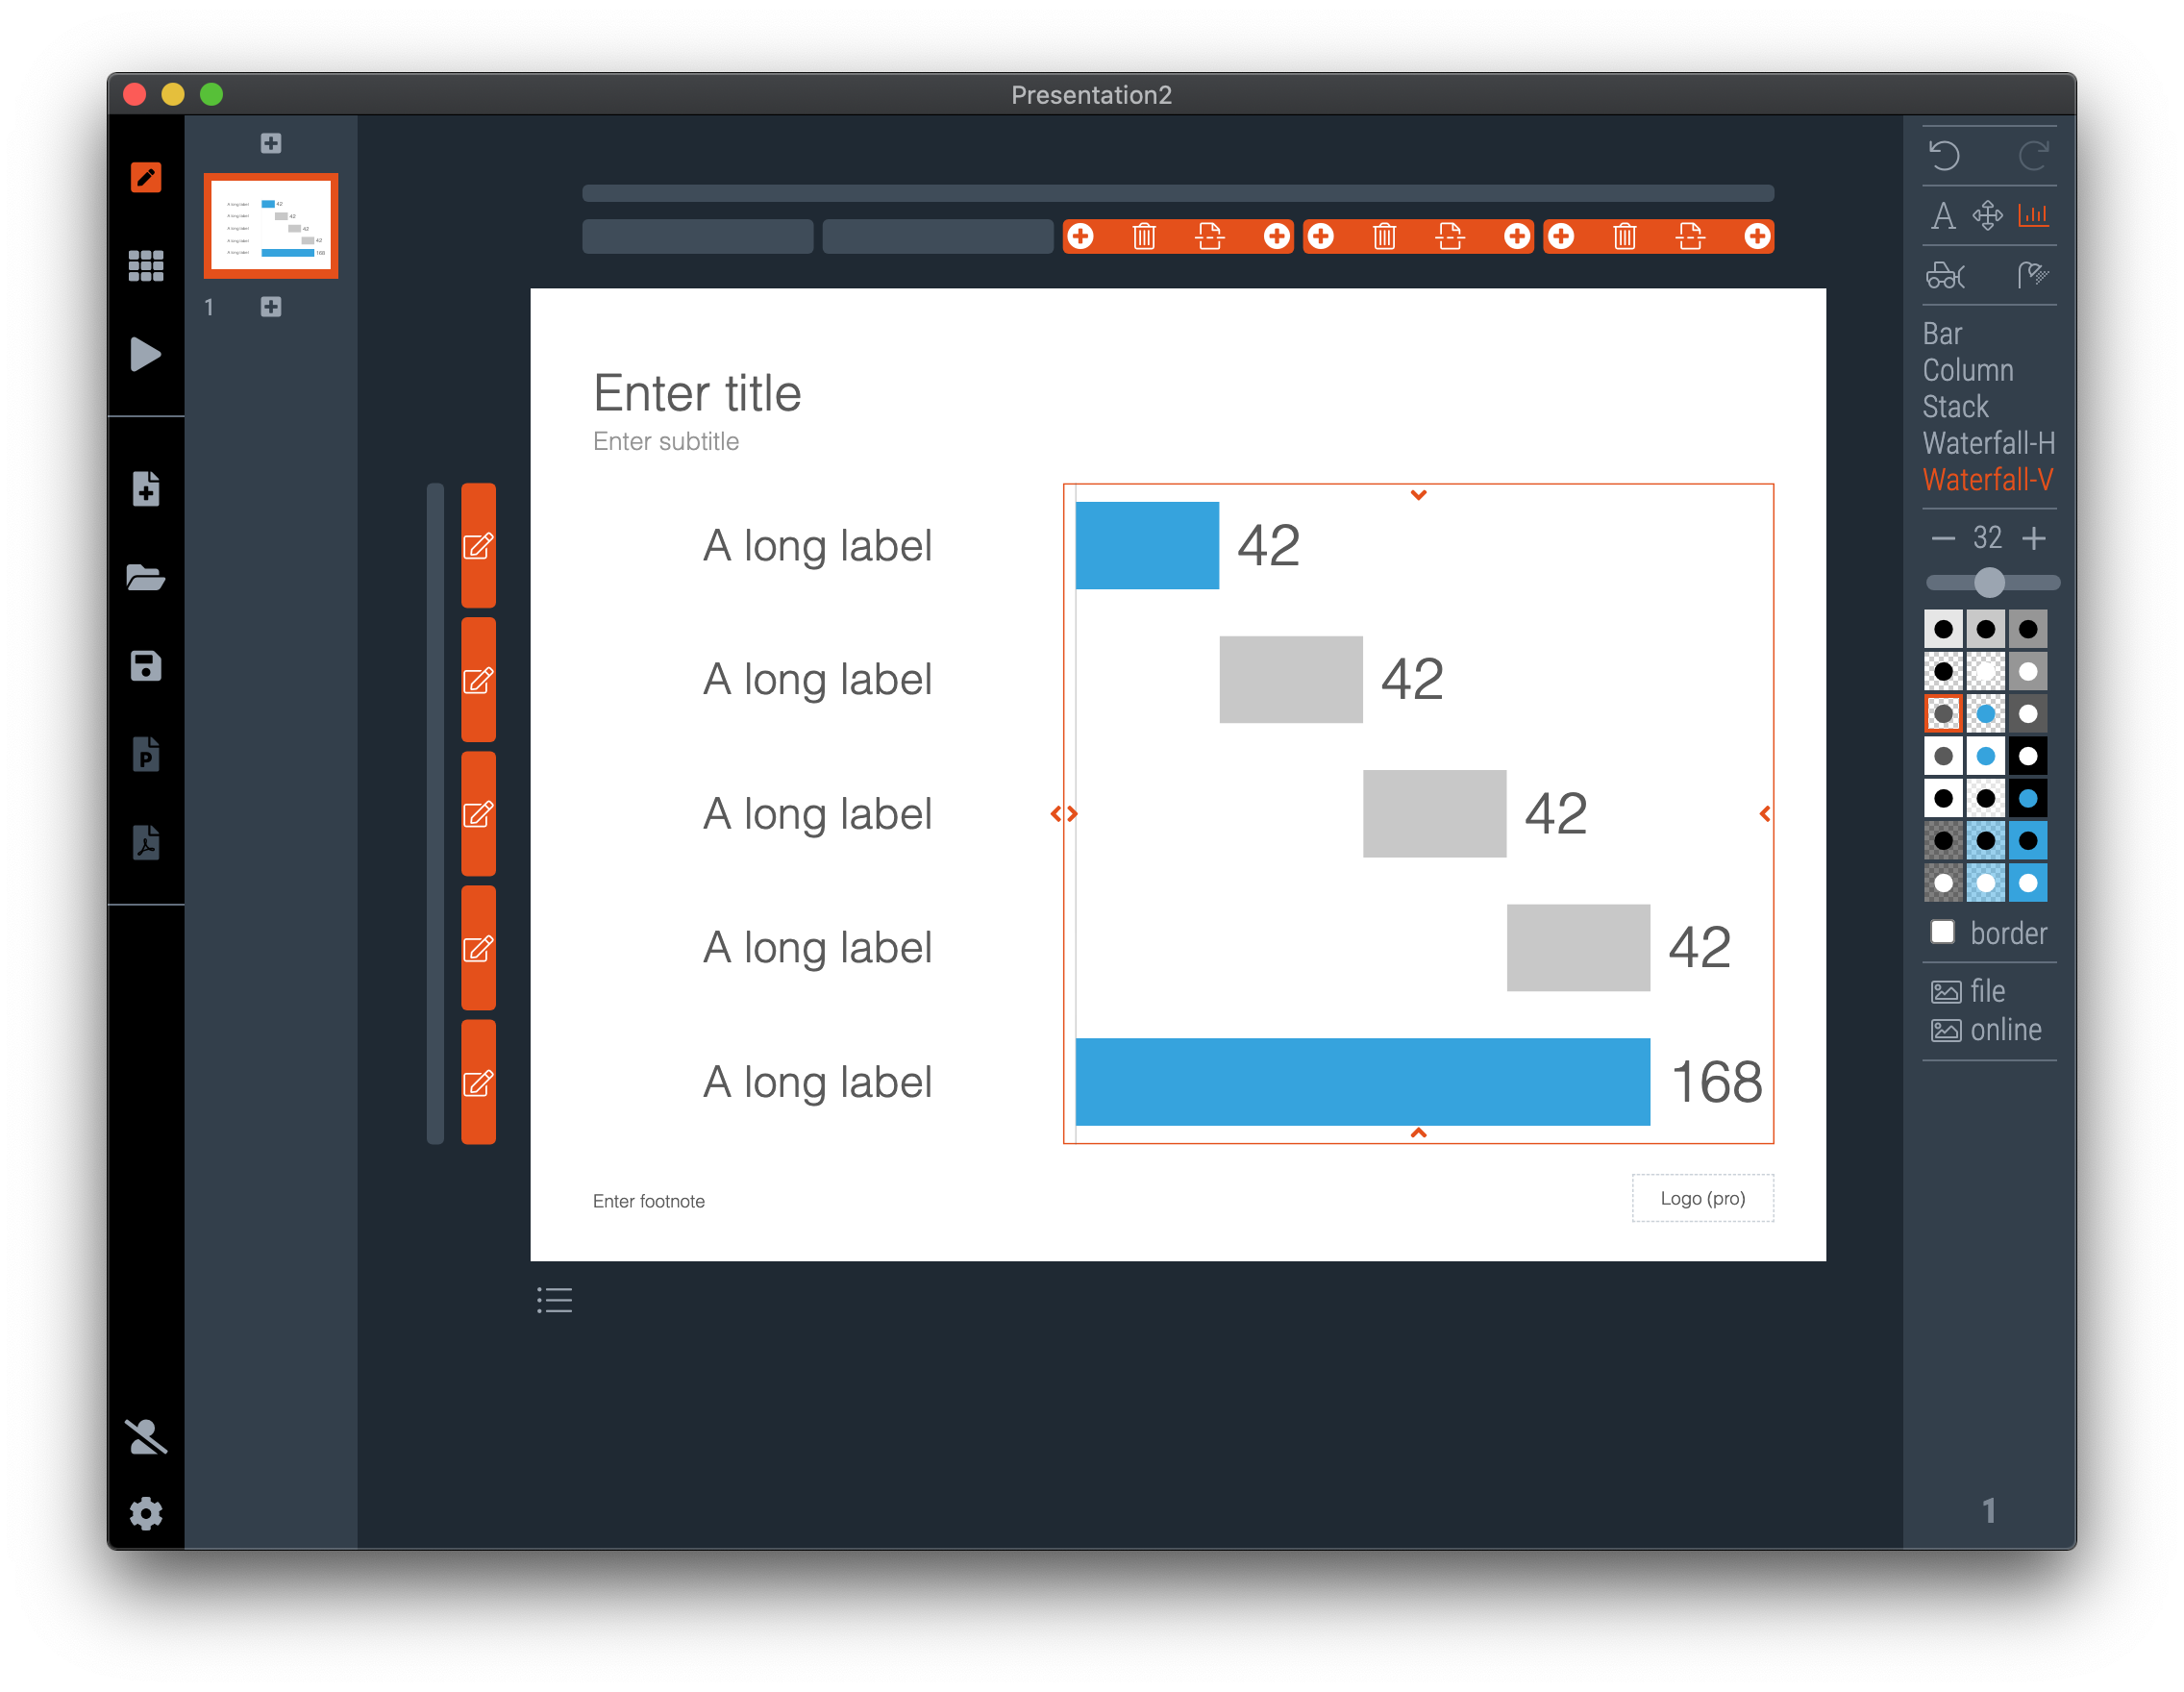
Vertical waterfall can handle long data labels better. For a vertical waterfall chart, you need to set the number of rows of the grid box equal to the number of data points
A waterfall chart needs at least 3 data points, (start, delta, end). If you are below that, the waterfall chart option that is not available is greyed out. Add another row to continue.
Still stuck? Contact support at [email protected]. EST + 7 hours, Sunday through Thursday