Centroids

Call me a nit picker, but I always feel this urge to fix the direction of a connecting line or an arrow pointing to an object in a slide, or to position an object exactly where it feels right.

Intuitively, I am looking for the centroid of a shape. Running complex mathematical analysis every time you need to place an object on your slide would be overkill, however, keep the concept in mind.


SlideMagic: a platform for magical presentations. Free student plan available. LEARN MORE

Brilliant: image cut outs in PowerPoint

PowerPoint does not have the rich image clipping and cropping tools that PhotoShop has. To take the background out of an image, you can set its background color to transparent and hope that the image edge come out reasonably clean.

Jose Arriaga recently started blogging about presentations on PowerPoint Symphony. He discusses an original alternative method: drawing a shape similar to an image and then fill it with the source picture as a background. Full details in his post here.

SlideMagic: a platform for magical presentations. Free student plan available. LEARN MORE

Setting the colors for Excel 2003 users

Increasingly, I use color schemes in Excel models as well. While I am about to switch to Microsoft Office 2010, I find that the majority of my clients (especially the large corporate ones) are still on Office 2003. Buried down in the Excel menus is a feature to set the colors that Excel 2003 users will see when they open files created in Excel 2007.
  1. Click the office button
  2. Go to the bottom and select "Excel options"
  3. Select "save"
  4. Click the "colors" button under "preserve visual appearance of the workbook"

SlideMagic: a platform for magical presentations. Free student plan available. LEARN MORE

Disqus comment engine issues

Apologies. I updated the template of my blog with Blogger's new template designer, but the Disqus commenting engine did not like it. All comments are still there, but they are not visible. Bare with me as I try to sort this out.

SlideMagic: a platform for magical presentations. Free student plan available. LEARN MORE

A different perspective

Most images have the perspective of someone who, well, stands up and look around. These 2 different ads (one here, and another one here) reminded me to look out for unusual compositions to keep your slides interesting.

SlideMagic: a platform for magical presentations. Free student plan available. LEARN MORE

"She"

The majority of presentations I see use "he" when referring to a customer, an employee, a user, a patient. I decided to use "she" whenever I can to compensate for this. Maybe you can as well.

SlideMagic: a platform for magical presentations. Free student plan available. LEARN MORE

More work in the public domain - Qelp

Most of my work is confidential, but there are some exceptions. An example is this presentation by Qelp, a startup based in The Netherlands that offers an online, picture-based, mobile phone support engine for operators. The people of Qelp have good presentation skills themselves, so I work more on a coaching basis: they deserve part of the credit for this presentation.

SlideMagic: a platform for magical presentations. Free student plan available. LEARN MORE

No point in arguing

Watching the disputes between players and the referee in the soccer worldcup reminds me of corporate negotiations. After the pitch presentation people start discussing the terms. Often, they are so preoccupied with their own viewpoint that they forget to listen or try to understand what the other party is saying. The same points get repeated, and repeated, and "let me explain to you one more time...". Nobody is listening, everyone gets annoyed.

SlideMagic: a platform for magical presentations. Free student plan available. LEARN MORE

Some RSS feeds with images

A reader asked me in the comments of my post on the Pulse News iPad app what feeds I put in there. Here are some sites for daily creative inspiration:
Please let me know what sources I am missing here.

SlideMagic: a platform for magical presentations. Free student plan available. LEARN MORE

But what is it?

Here is a big sentence on the front page of a new web site targeted at iPhone users:
[Company] develops real-time personal discovery and contextualization technologies that leverage semantics and social attention to make social streams more relevant.
Industry insiders might understand what it means, but most people will not. I am not a big believer in mission statements. Often, the big wordy sentence that covers all will be the most compact way you can describe your business to yourself, but as you suffer from the curse of knowledge, other people will not get it.

SlideMagic: a platform for magical presentations. Free student plan available. LEARN MORE

Immersing yourself in images with an iPad

Every day I like to browse through an enormous amount of images from photography, art, design, and advertising sites to get inspiration for my presentations. The iPad is making this a whole lot easier.

Applications for the iPad are still in their infancy. Many RSS reader applications are popping up, partly driven by the fact that Google Reader does not work very well in the iPad browser (scrolling down is hard).

One iPad RSS reader app, Pulse News, is making an effort to mimic the iPad user interface by rendering content "iPad-style": creating a stream clean headlines with images ripped from the RSS feed. For your regular feeds, this is a nice gimmick, but the draw back of the app is that you can only put in 20 feeds, by far not enough.

But for my image feeds this is brilliant. I follow less than 20 feeds and with the touch of a finger I can fly through days of content in a few seconds, just images! Try it if you own an iPad.

SlideMagic: a platform for magical presentations. Free student plan available. LEARN MORE

Unstretch that screen

More and more presentations are given on plasma/LCD screens with a wide aspect ratio. Most PowerPoint presentations are designed for a narrow 4:3 ratio (a traditional computer monitor). Most of the time, the screen will automatically stretch you image to create a bigger picture. I never understand this habit: the distorted proportions look horrible. (Judging by my own experience, this is how most people watch TV nowadays as well).


My advise: set the screen back to the narrow aspect ratio. Doing this on your computer is often tricky, the best way is to take the remote control of the screen and fix it there. A smaller picture is much better than a distorted picture.

The painting is Manet's Portrait of Irma Brunner.

SlideMagic: a platform for magical presentations. Free student plan available. LEARN MORE

Relating the oil spill to your city of choice

More maps today. This simple site ifthiswasmyhome puts the size of the oil spill in perspective... using a town of your choice. It would cover pretty much the entire Netherlands (the country where I grew up).
An excellent visualization, making people internalize what big numbers mean.

SlideMagic: a platform for magical presentations. Free student plan available. LEARN MORE

We need a good document browser

A week with an iPad has shown me how poor presentations and other documents get rendered on a PC (or a Mac). Leaving the touch screen aside, and even for a PDF viewer, navigating between pages is incredibly slow and the borders of the screen are packed with distracting menus.
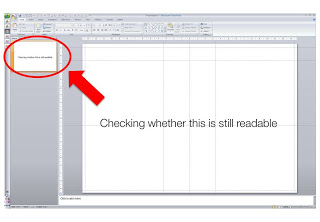
Maybe this can all be brought back to the roots of these applications: they were designed for editing text line by line, changing data cell by cell. Each page is built up real time from its components. Editable text gets pet in the right font, the right size, aligned, images are scaled to the right size, colors added. All this takes processing time. The iPad (I think) converts the whole document to some sort of image and caches this image into memory. The result is lightning fast scrolling between pages in a document.
There is no reason why this cannot be implemented on a PC/Mac as well. It is bit like the revolution of the Firefox and Google Chrome browsers that were specifically designed to render content as quickly as possible.

SlideMagic: a platform for magical presentations. Free student plan available. LEARN MORE

OK - I ordered PowerPoint 2010

I decided to upgrade to PowerPoint 2010 (affiliate link) not because of the features that are discussed in most reviews, what interests me is the ability to create customer complex shapes (adding, subtracting), something that until now only was possible in Adobe software. Although I would be interested in the video functionality as well (the complexity of video editing software prevented me from getting serious with motion graphics).
On a separate note, the world of office software is changing. I used to be a loyal buyer of the "Professional" edition since the early days. Not any more. Excel has become so powerful that I see no need for Access anymore (99% of my clients do not know how to deal with this software), and I still get Outlook bundled with my Excel and PowerPoint, although I will probably never open it now that I have moved completely to Google for email, calendar, and contacts. (Another reason not to take the Professional suite: Microsoft has abandoned their upgrade pricing scheme.)
I will post my experience with PowerPoint 2010 in future posts.

SlideMagic: a platform for magical presentations. Free student plan available. LEARN MORE

Constantly checking readability

When I design my slides I usually leave the outline pane open on the left side of the screen, so I get a sense of what an audience member sitting in the back row might see when the slide gets presented.

SlideMagic: a platform for magical presentations. Free student plan available. LEARN MORE

Clip art comeback?

I have been avoiding clip art for many years in my presentations. The graphics look clumsy and cliche compared to a high quality stock image. (Sometimes I am longing for that screen bean though).
After reading a few posts on Tom Kuhlmann's Rapid e-learning blog I might change my mind though, maybe. All these big image, big text slides start looking sort of the same. Some ideas by Tom:
  • Edit your clip art to make it interesting. Dramatically scale them up, so they become huge on the slide. Ungroup the object and remove items you do not need, or even swap heads on characters. 
  • Keep the style of your clip art consistent. I did not know that you can search for specific consistent clip art styles, this one for example: style 802. More examples here.
  • Clip art is a good source to make black silhouette characters.
Add Tom's blog to your RSS reader if you are interested in this.

SlideMagic: a platform for magical presentations. Free student plan available. LEARN MORE

Telling a story with an interactive map

This interactive map is amazing: click a US county and it shows you were people who live their move to, and from where people are moving into this area. This is a (very cool) tool, but some serious DIY analysis is required to tell the story though.
I clicked around a bit and discovered some patterns:
  • Lots of people are moving back and forth between big cities
  • In the mid west, people move within a short radius
  • Upper east coast people move (retire?) to Florida
  • Etc.
To use this in a presentation there is no avoiding to going back to a series of screen dumps to take people by the hand through the data. (I am not a big believer in live demos during short presentations.

SlideMagic: a platform for magical presentations. Free student plan available. LEARN MORE

Condensing dozens of pages of market research into one

Some market research agencies must be paid by the page. Reports are filled with pages of text describing the market: United States: segment 1, 2, 3, volumes, revenues, pricing, Asia: the same, Europe: the same. All in long full text sentences ("The U.S. segment 1 market was $1.345bn in 2009, up 3.125% compared to the year before. On the other hand, segment 2 declined by 3.54% versus 2008 and is now $2.675bn in 2009").
Text is not the right way to convey this information. A simple one-page table with rounded figures can replace the entire document. And hey, you might even be able to put it on one slide in your presentation.

SlideMagic: a platform for magical presentations. Free student plan available. LEARN MORE

Maps: an increasingly important visualization tool

Look at this beautiful visualization of images taken in London. Blue: images taken by locals, red: ones by tourists (more cities here).
I am using maps more and more in my presentations. A map with color-coded segments is a much more powerful way to visualize data than a bar chart with a ranking of variables. I am still struggling to find good tools. There are very few good editable PowerPoint maps available, and Google maps screen shots are a bit cumbersome for large volumes of data points. Suggestions?

SlideMagic: a platform for magical presentations. Free student plan available. LEARN MORE