Traffic lights in PowerPoint

Traffic lights in PowerPoint

Now and then, I use the good old traffic light chart to present the progress in a project: who has given "the green light" and where things are still stuck. These icon-style shapes are easy to create in PowerPoint. I usually start with Googling a few example images/icons, then see what basic shapes are needed, to finish with the composition I like.

Click the image above to be taken to the traffic light slide in the store, subscribers can download it free of charge.

SlideMagic: a platform for magical presentations. Free student plan available. LEARN MORE
Digging yourself in a hole

Digging yourself in a hole

I have to be cryptical not to give away the confidential details of a project I am working on, sorry.

Some opinions are universally agreed upon, no facts, backup, or convincing is needed. (Unless you want to disprove the common understanding). Still, many consultants cannot resist and launch an effort to quantify something that is blatantly obvious, but is extremely hard to quantify exactly.

In a legal case, this non-issue, all of a sudden turns into a major obstacle:

  • Shaky assumptions can easily be attacked from left, right, and center, putting the credibility of your entire presentation at stake (what if all the other analysis was this "sloppy"?)
  • Lots and lots of data takes time to present, and all of a sudden this issue which is either already agreed upon, or not important at all, is taken up 75% of the presentation time and discussion. The "after taste" of the meeting is the impression of expensive consultants that could not defend their numbers.

Always ask yourself: do I need to convince the convinced, how important is this issue, and when is the best time to bring it up (if at all)?


Cover image by Vladimir Kramer on Unsplash

SlideMagic: a platform for magical presentations. Free student plan available. LEARN MORE
Two types of PowerPoint templates

Two types of PowerPoint templates

The Internet is littered with PowerPoint templates that fall roughly in 2 categories, I would classify them as follows:

  1. "Potpourri"-style
  2. "Adobe InDesign"-style

Potpourri. These are the slide templates that have been around since the mid 1990s.

  • Not very pretty: a very "PowerPoint" design with gradients, bevels, shadows that is often trying too hard
  • Hard, if not impossible, to integrate with prescribed corporate template files
  • Filled with cliche icons and stock photos 
  • Sites offer "tens of thousands" of slides, but they are highly inconsistent across designers

Adobe Indesign. Recently, print/web designers have been branching out into the world of PowerPoint: creating very pretty designs that look a lot like the finished product that is created in Adobe InDesign. But there is a reason that InDesign-style presentations do not work very well for everyday business presentations:

  • They tend to ignore the way PowerPoint works with template slides: instead "hard coding" text boxes, shapes, and images on a blank page. This is very hard to customise as a non-designer, and it is impossible to fit into a corporate PowerPoint layout
  • They mostly are designed around paragraphs of text. Headlines are big and bold, but text is incredibly small. From a distance the grid of images and paragraph text looks pretty, but it is impossible to read.
  • The compositions are dependent on exactly the amount of words, pictures, paragraphs that are presented in the template slide. Have more text, one more option, less text, and you have to redesign an entirely new grid layout.
  • Custom fonts make porting the source files between devices hard (most people don't even bother and in no time the presentation will end up in Arial).
  • The layouts are all about presenting lists, or blocks, there is no visual movement that is important in business presentations: cause-effect, pros and cons, trends, sequences. 

I am not linking to examples of the above categories since I do not want to single out individual template providers.

The SlideMagic app and template store try to create a corporate visual language that will not look as pretty as the "InDesign" slides, but has a good enough design. What I give away in terms of design, pays back big time in terms of practicality.


Cover image via WikiPedia

SlideMagic: a platform for magical presentations. Free student plan available. LEARN MORE
Is TED becoming stale?

Is TED becoming stale?

This tweet passed by recently:

Yes, I agree that the excitement about attending the actual conference is not anymore what it used to be, and people are starting to make fun of giving a presentation TED style...

But, the main TED conference, the local TED sessions, and the online library have made a huge change about how people prepare and deliver presentations. And, maybe even more importantly, by showing what a good live presentation actually is, they might have changed the agenda of many corporate meetings. Rather than everyone politely sitting through hours and hours of slides that will never be TEDTalk (next year's budget for example), it might be better to just do a Q&A / discussion.


Cover image by Gisela Giardino

SlideMagic: a platform for magical presentations. Free student plan available. LEARN MORE
Graduating as an analyst

Graduating as an analyst

I have a few very long standing clients, often going all the way back when I started my presentation design business. They are mostly very large corporations where I work for many departments. Inside these I have followed along very junior analysts which are now rising in the ranks of the company.

I have seen this scenario in multiple versions:

In the very early days, they would be the ones in the background, providing me the data analysis for a presentation design project that would cover a much wider area than they would be responsible for.

Then they would contact me on their own (outside these big projects) with little slide requests and we would find a way to work together on a very small budget. And step-by-step, this analyst would pick up slide design skills, basically establishing their own minimal slide library of designs they could always fall back to (see an earlier post about this). As a next step, they would become bolder in the way they structure their presentations, having the courage to cut words, add an image and even some humor here and there in their slides.

These people can now produce pretty decent slide decks, not master pieces of design, but effective documents that speak the language of top management, enabling them to leave the analyst/engineering pool and making the next step in their career. This ability to teach yourself these basic presentation skills has been a big factor I think why they are moving ahead.

And it is exactly these types of slides that you will find in the SlideMagic store: useful design that help you create an everyday business presentation quickly.


Cover image by Ankush Minda on Unsplash

SlideMagic: a platform for magical presentations. Free student plan available. LEARN MORE
Pitch deck alternatives

Pitch deck alternatives

Venture capitalist Fred Wilson describes 3 alternatives to the traditional pitch deck:

  1. Short video
  2. Short podcast interview
  3. A well-written letter

They are all great suggestions, some observations:

  • All these are substitutes for the "first shot" pitch deck, where the VC is absorbing your idea for the first time, as Fred says to find out: "if they are a fit with our thesis and of interest to me and my colleagues at USV" He will spend a few minutes max on these pitches. You still will need other, more elaborate materials in the next stages of due diligence.
  • See how important information about you, the founder is: videos and podcasts give away a lot about you as a CEO, entrepreneur, people manager, Board Member
  • All of the above are as hard to get right as a good traditional pitch deck (especially the letter is really tricky). Just recording a video in itself will not give you a better chance to succeed. Seeing the first 10 seconds of a poor video, or reading through the first bullet of a poor slide deck are equal turn offs.

Cover image by Daniel McCullough on Unsplash

SlideMagic: a platform for magical presentations. Free student plan available. LEARN MORE
The point is that there are many points

The point is that there are many points

Everyone knows (from experience) that bullet point charts full of text don't work. Still, now and then, I need to make a chart that is full of points, literally.

Why?

To make the point that there are tons and tons and tons of arguments in favour of something. The business, the abundance of points, IS the message of the chart.

How do I keep it readable?

Separate the chart that makes the point that there are lots of points from the slides that actually explain the points:

  • Show the overview chart that lists all the points, but not as written out sentences. For example, you can use circles with short descriptors in them: "low cost", "quick", "beautiful". Resist the temptation to go into detail about each of the circles,
  • Bring all (or a subset) of the arguments to the forefront with individual slides, here you can show your cost comparisons, speed comparisons, etc.
  • After the supporting slides, bring back your original chart with a slightly different headline

Note that this is an exception. Most arguments can be nailed with 3-5 decisive points. Rarely, I encounter the logic that "Each of these points are 'mah', but if you add them all up, a compelling case arises". In that case, use the above approach.


Cover image by averie woodard on Unsplash

SlideMagic: a platform for magical presentations. Free student plan available. LEARN MORE
Improve your English

Improve your English

I have been a follower of Clare Lynch on Twitter for a while, and recently started watching her quick videos with tips how to improve you English as well. They are worth watching! She takes a very pragmatic approach when it comes to business writing, giving us permission to break some of the rules we were taught back in high school in the interest of clear and concise writing. 

SlideMagic: a platform for magical presentations. Free student plan available. LEARN MORE
Lower post frequency

Lower post frequency

I will be taking some time of over the next week with my family and some good friends, and blog posts will be less frequent than usual. Most of my blog posts are almost live, and as a result I don't have a long post buffer that I can use to pretend that I am writing 365 days in the year.


Cover image by Vesela Vaclavikova on Unsplash

SlideMagic: a platform for magical presentations. Free student plan available. LEARN MORE
My presentation training in 1996

My presentation training in 1996

In the middle of the house and office declutter exercise, I found my credit card-sized reminder of things I should work on which I wrote after a communication training at McKinsey, back in 1996 when I just returned from INSEAD:

presentation-training-tips.jpg
  1. Avoid the "Napoleon hand", I seemed to have difficulty finding a natural position for my right hand
  2. Finish a point completely before jumping into the next slide / topic
  3. Introduce a slide before putting it up (McKinsey data slides can be overwhelming)
  4. Maintain eye contact with the audience
  5. Use a loud (maybe confident?) voice

I think I had a few strengths as well, but did not bother to write them down (I hope :-) ).

That little card might survive the declutter tornado.


Cover image by Margarida CSilva on Unsplash

SlideMagic: a platform for magical presentations. Free student plan available. LEARN MORE
Cartoons in presentations

Cartoons in presentations

Want to use a cartoon in your presentation? Here are some things to consider:

  • Humor in a presentation can work, but be careful what sort of jokes you pick. A cartoon that was very funny late last night when you prepared the slides, could not fit the meeting context the next morning after that earlier remark that did not go down well. If you hardwired the wrong cartoon in your slide deck, make sure to click-skip really quickly.
  • Do you have the copyright for the cartoon you just found on Google Image search?
  • Does the cartoon actually add something to the presentation, or is it a business cartoon cliche?
  • Can the audience actually read what is written on the cartoon from the back row?
  • And finally, do you give the audience enough time to read it? As soon as you put a cartoon on the screen, everyone will start squinting to read what Dilbert has to say, and no one is listening anymore what you say at the same time. It might be best to pause your presentation until the first giggles start emerging from the audience. And remember the audience reads the cartoon for the first time, and needs more time than you to understand it. If you have to, you might have to read out the cartoon to the audience.

Cover image by Samantha Lorette on Unsplash

SlideMagic: a platform for magical presentations. Free student plan available. LEARN MORE
All over the place

All over the place

A debate about a contentious complex issue with lots of people in a room is unlikely to go anywhere. If you are asked to make a presentation to run such a meeting, here is what you need:

  • Data slides with one issue per slide that clearly state how data (or logic) supports your point. One issue per slide is important, you want people to really understand what you did, and more importantly, you don't want other debates about other issues when getting people to buy into your analysis.
  • A logic flow that chains all these data slides together into a coherent argument. This is your typical stand up presentation: clear visuals, that deliver a compelling presentation
  • Then, when the fireworks start, a slide that actually groups all the issues and arguments on one page, even if this means cramming in more information than you usually would on one slide. Don't try to put all the data on this slide, but give each issue a physical location on the slide. Maybe project it on a whiteboard so  you can write on it, and spot when people making the same point again, discuss a completely unrelated issue, disagree about the validity of the source data, dispute the validity of the analysis, etc. etc. Collapse the issues people agree about to create more space for the contentious arguments.

Good luck!


Cover image by Peter Nguyen on Unsplash

SlideMagic: a platform for magical presentations. Free student plan available. LEARN MORE
Decluttering

Decluttering

We are going through a small refurbishment of our home at the moment, it was badly needed after our kids spent the first decade of their lives in our place. This all causes some disruption, but also has some upside: I need to pack up every single item in the house (and office), and make a conscious decision whether to put it back or not.

I tried doing a (minor) clean up 3 years ago, and can now see the exact items I decided to keep sitting at exactly the same spot where I left them. This was a great encouragement to do things properly this time. 

Highly recommended, even if you do not need to repaint your home and office.


Cover image by Ashim D’Silva on Unsplash

SlideMagic: a platform for magical presentations. Free student plan available. LEARN MORE
Creating your own presentation style

Creating your own presentation style

SlideMagic is all about cutting the time that people spend on creating and sitting through presentations. Most presentation decks are decision documents where people need to agree on a deal, budget, or plan. Things need to look decent, but most of all, they should be effective and simple to put together.

What can help a lot is developing your own visual language. A very limited set of slide layouts that look good, and you know how to manipulate and customise to the specific situation. You will be surprised how few templates you need to build a business presentation. Most slides show an image of something, make 3 points, compare 2 options across 4 dimensions. It only takes a few layouts to cover these.

So with your own (small) slide template library:

  • You work faster
  • You can invest time to make them look good, it will pay of when you use them again
  • You create presentations that are very recognisable "you"

The standard slides in the SlideMagic template store are pretty much my personal template library. (By standard I mean the tables and text grids, not the slide with the herd of sheep for example). As a professional presentation designer, my required library is probably far bigger than the one you need. 


SlideMagic: a platform for magical presentations. Free student plan available. LEARN MORE
Years in columns, which way?

Years in columns, which way?

In financial statements, the most recent financial period is put first, and next to it is the previous period for comparison: 2017 - 2016. To the frustration of some accountants and CFOs, I insist on putting the years the other way around: 2016 - 2017.

  • The eye is used to moving left to right when looking at time series data
  • It makes tables match line or column graphs that are in the presentation
  • It makes it easer to compare data across 3 years or more

I am not trying to change the reporting practices for financial statements. In the annual accounts, the current year is the most important one. It needs to be accurate and is usually shown with far more digits (precision) than I would use in a presentation. A comparison to last year's numbers is almost an extra, not the main purpose of the page.

Every financial document has its own purpose and own audience: spreadsheets, financial statements and presentation decks. And among presentation decks you can distinguish between quick and dirty documents to discuss (early results), detailed financial information for the investor community, and more generic financial slides for a general company presentation. Different purpose, different slides.

If you want you can check out financial slides in PowerPoint in my template store. Subscribers can download them free of charge.

SlideMagic: a platform for magical presentations. Free student plan available. LEARN MORE
Trees!

Trees!

A tree visualises the composition (or decomposition) of a number into a number of factors. They are what I call ponder charts, not to be presented during a TED talk, but rather they are useful for  (complex) studying relationships between different factors.

Below are two examples of these analysis trees. The first is a summary profit and loss account for a company. I often use these a tree like this to visualise the business model of a startup by forcing a forecast year 5 P&L of a success scenario into this format. It is impossible to forecast the future accurately, and investors and founders will always disagree on the numbers, but the tree teaches you how to think about this company. What drives its economics? What would you have to believe for the year 5 scenario to be true? A tree always has to add up and multiply, this often leads to insights when it forces you to fill in boxes that you did not originally take into account (i.e., you forecast your sales, you assume market size, and right in the middle sits your implied market share).

A second example is this return on invested capital tree. It explains how (and more importantly, why) company performance is changing over the years. In this version I added miniature line diagrams to make the annual trends clearer. PowerPoint cuts the vertical axes of these graphs automatically, amplifying the trends in the line graph. Normally, I would object to this form of lying with statistics, but in this case with the very small diagrams, it is actually useful.

Both these trees go from left to right, sticking to the McKinsey style of going from big picture to detail. 

Clicking the images takes you to store where you can download the finished slides, subscribers can do so free of charge.

SlideMagic: a platform for magical presentations. Free student plan available. LEARN MORE
Starting to use the store myself

Starting to use the store myself

Recently, I have started to use the template store myself for the few bespoke design projects I still do for long standing clients (SlideMagic gave me a really attractive rate :-)). My hard drive is filled with 1000s of slides and still it is difficult to find a nice clean layout to use as a basis for slide number 1001.

Up until a few weeks ago, I started every slide pretty much from scratch, I have gotten pretty fast in setting up yet another 4x5 table grid. But even I can't beat search the store for "table" and re-download that slide again and hit the ground running.

I am continue to monitor which slides people decide to buy, and which slides are downloaded by subscribers. Many subscribers download a lot of slides right after they made the purchase, and then don't return for a couple of weeks. Initial downloads include slides that you can only use in very specific situations, like these sheep. They hardly ever download the same slide 2x. There could be 2 possible explanations:

  • Less likely: after that $99 annual subscription, you better make sure you get what you paid for, maybe the store will stop running somehow before the 12 months are up.
  • More likely: we have built up the habit of mining through old decks, and recycling slides into a new presentation.

As a designer who now uses its own store, I would encourage you to think Netflix, iStock, Spotify: your slides will always be there, and search is there to help you find the slide you need at the moment (and nothing else). Change your design process:

  • From: open your consolidated SlideMagic deck (which took time to assemble from all the individual slides you had to download), pick 20 designs you think you are going to need, see how you can tell your story with these 20 designs
  • To: scribble your story flow on a piece of paper, create a deck of empty slides with just titles, search the appropriate slide template on SlideMagic

It will take you less time, and you get better presentations. And remember: I am constantly adding new slides so your first burst download will run out of date soon.

Having said that, I am willing to look into a technical solution to combine multiple slide downloads in one deck, my commerce platform cannot handle that (yet).


Cover image by Henrik Dønnestad on Unsplash

SlideMagic: a platform for magical presentations. Free student plan available. LEARN MORE
Stock photo celebrities - 2018

Stock photo celebrities - 2018

Unsplash has become a fantastic resource of images: the quality of the photos is better than stock photo sites, and all of them are completely free of charge. I have been seen it growing from a static page with 1 free image a week which took forever to download into what it is today.

My stock photo use has dropped dramatically over the past years: I use fewer images (increasingly preferring simply bold typography), and if I use them, I either select "real" images of an actual product, store, city, or, I use Unsplash.

Stock photo celebrity from the past

Stock photo celebrity from the past

I am not the only one who has discovered this, and we now see the same thing happening as with stock photo sites 5 years ago: next to stock photo celebrities (this call centre rep for example), we now get Unsplash celebrities.


rawpixel-com-340972-unsplash.jpg
rawpixel-com-411169-unsplash unsplash cliche.jpg
rawpixel-com-358746-unsplash.jpg
rawpixel-com-569602-unsplash.jpg

The 4 image above are contributed by rawpixel.com, which added many other images as well which are not (yet) as recognisable as these 2 "business people".

SlideMagic: a platform for magical presentations. Free student plan available. LEARN MORE
Sensitivity analysis in PowerPoint

Sensitivity analysis in PowerPoint

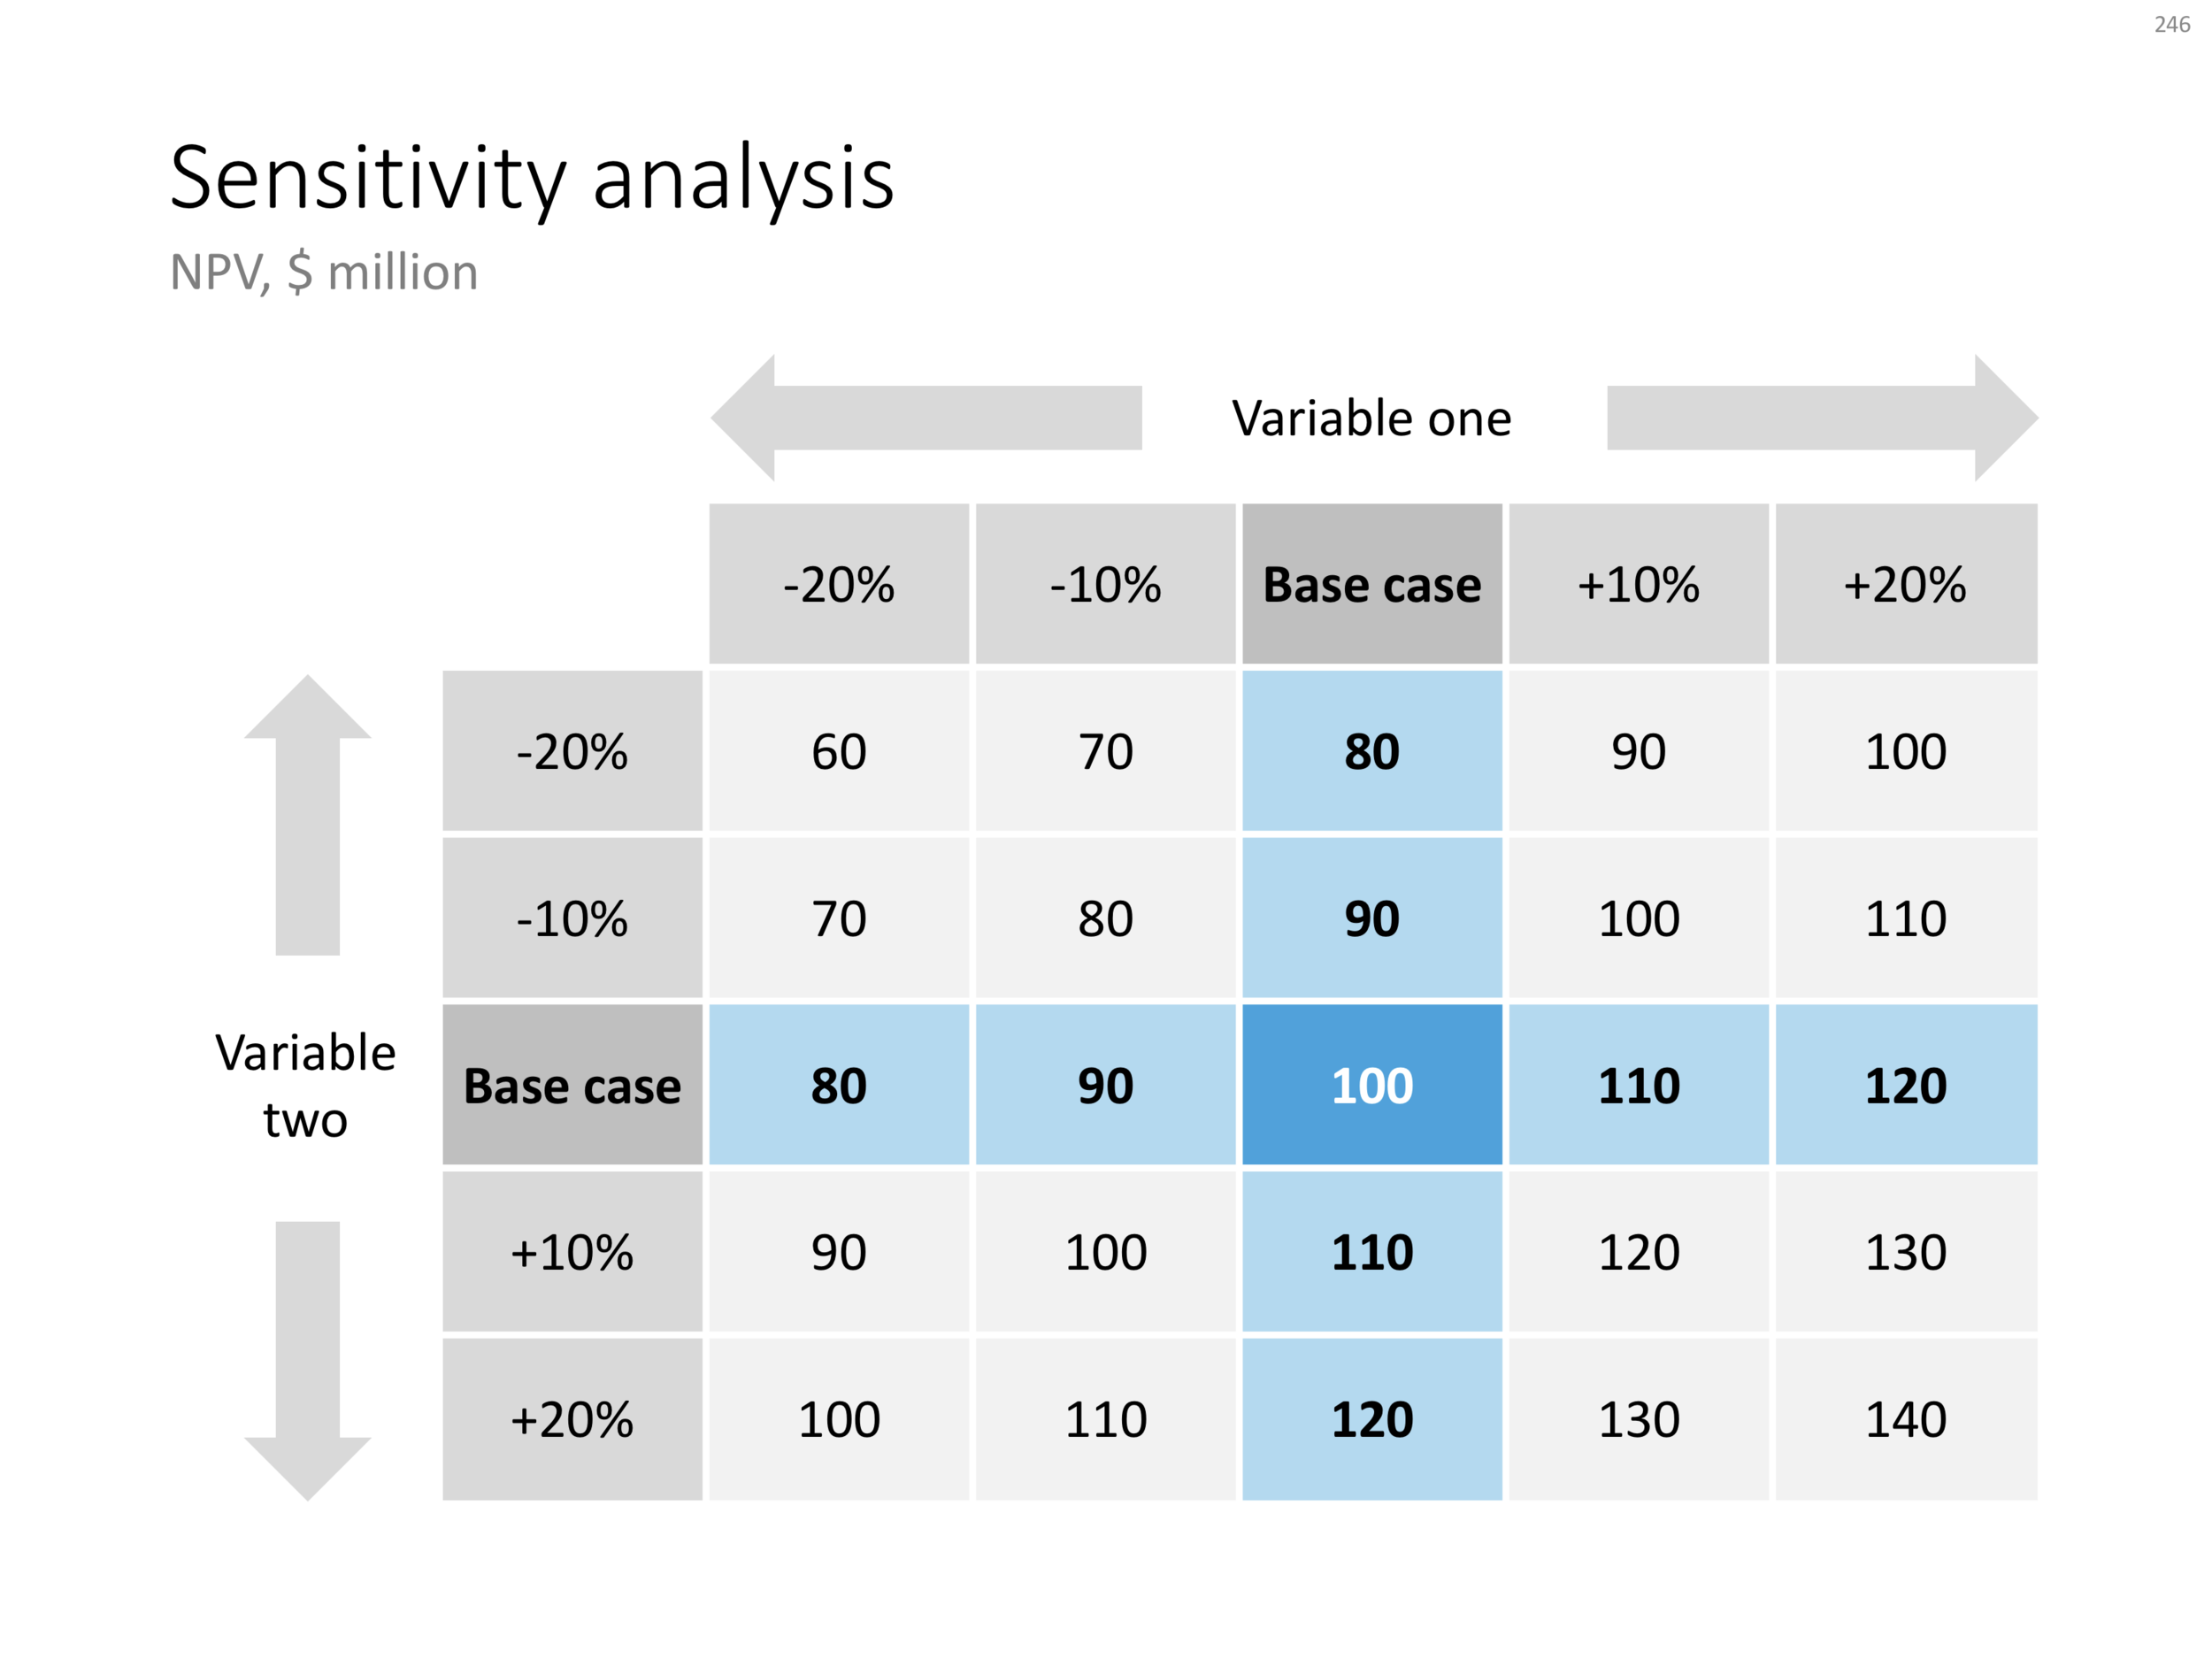
Today, I am adding a simple table to the store to show the sensitivity of an analysis. Each cell in the table shows an outcome of an analysis with a slight variation on 2 critical input variables. I used this type of a slide a lot in discounted cash flow valuation models, where assumptions about discount rates and assumed perpetual growth could make a significant impact on the outcome of your analysis.

The base case scenario is put very prominently in the centre of the table, it is the anchor for the viewer from which to start studying the other scenarios. I prefer making these type of charts manually, and not via a blanket copy-paste out of an Excel sheet. In that way, you have to think about whether each cell in the table is meaningful, and you can make sure that the data is formatted and rounded in the best way.

You can download this sensitivity analysis from the store, subscribers can do so free of charge.


Cover image by Markus Spiske on Unsplash

SlideMagic: a platform for magical presentations. Free student plan available. LEARN MORE
Quick reformat of the YCombinator Seed Deck Template (free)

Quick reformat of the YCombinator Seed Deck Template (free)

The application deadline for the next YCombinator is coming up and the incubator posted a suggested seed-stage investor pitch deck template. I quickly ran the template through a make over process using templates available in my store. The resulting pitch deck template can be downloaded free of charge.

Some comments:

  • This is a seed stage pitch deck for an investor which has very specific opinions/requirements about sourcing investments: early stage, seed stage businesses are extremely fluid and change/pivot so many times that there is little point in long-winded elaborations, given the volatility of these extremely early stage businesses, the team is the biggest indicator whether there is a chance that the company will be successful.
  • YCombinator is proud that they can see through fancy-looking decks, you probably even get points for not wasting time on PowerPoint slides, and instead focusing your efforts on the company (pretty much the philosophy behind SlideMagic). This might not work with all investors (hence the slide upgrade in look & feel in my remake).
  • The big selling point in this deck is obviously the placeholder for traction and growth, not many early stage companies will be able to produce the numbers for that "hockey stick" (yet).

All in all, these are good guidelines for crafting a pitch deck for a highly knowledgeable investor. I would up the graphical finish just a notch to make it look more pleasing, without overdoing it. That's what my template tried to do. 


Cover image by Evan Kirby on Unsplash

SlideMagic: a platform for magical presentations. Free student plan available. LEARN MORE